
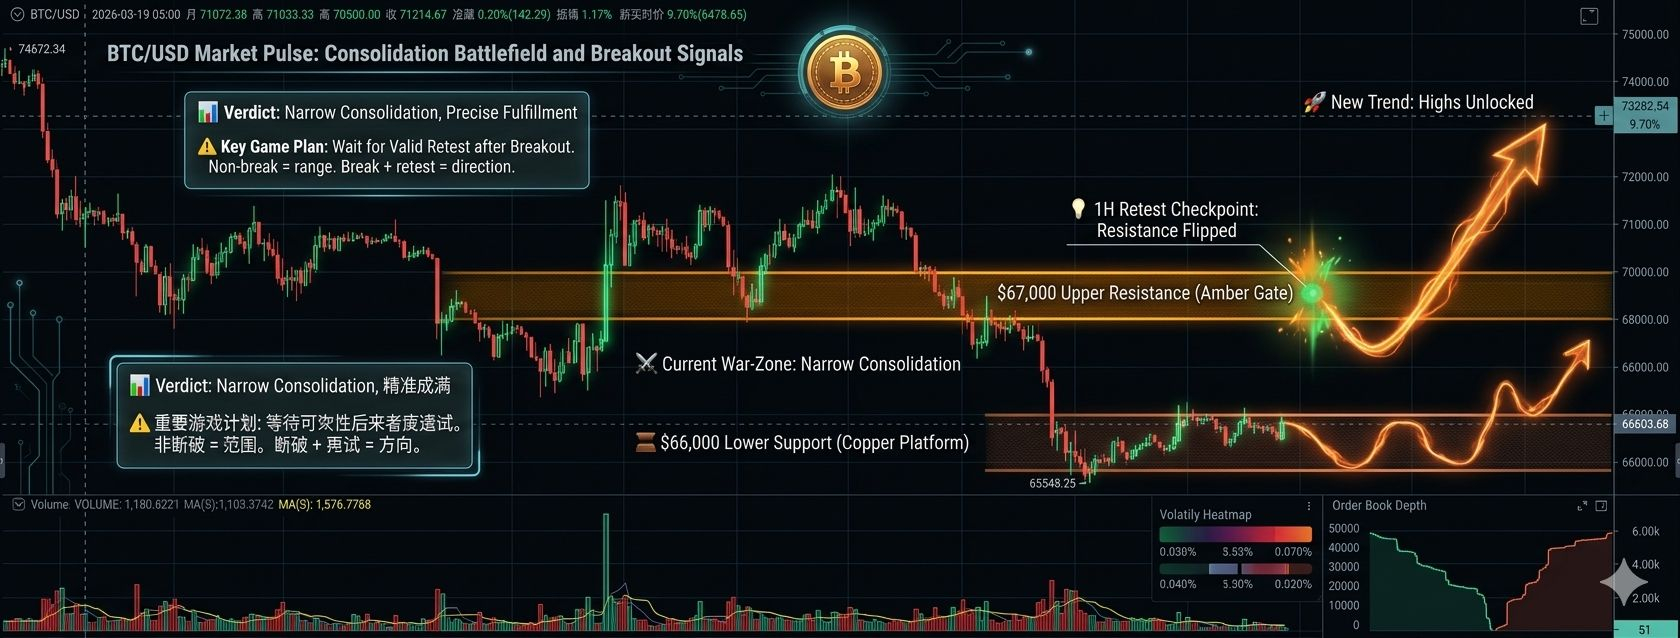
Let’s start with the conclusion — the previously predicted range oscillation is currently being accurately realized.
Current $BTC quote $66,770, which has been consolidating in the narrow range of $66,000 ~ $67,000 for two full days.
See the chart (1-hour K-line).
——————————————
Next, focus on two prices:
$67,000 upper resistance
$66,000 lower support
These two lines represent the boundaries of the current market.
If it doesn't break through, it's oscillation; if it breaks through, it's direction.
——————————————
There is a detail that many people tend to overlook, let me explain:
What does 'waiting for a breakout and then a pullback' mean?
For example, if the price really breaks above $67,000—at that point, don't rush to chase, wait for it to drop back and then reassess.
If it drops back to $67,000 and does not fall further, it indicates that this position has turned from resistance to support, making this breakout valid, and the market will really open up.
This is what is known as 'resistance turning to support', one of the best methods to judge the current direction on the 1-hour chart.
——————————————
From a daily chart perspective, it also maintains a consolidation expectation, and there are currently no clear signals of a larger direction.
Waiting for the outcome in the range of $66,000 ~ $67,000.
Wait for signals, execute as planned, it's that simple.
Give a thumbs up, and I will continue to follow up with updates 👍
Click $BTC to view real-time market trends 👇

⚠️ Personal analysis, not advice, risk is borne by yourself.
#BTC #Bitcoin #MarketAnalysis #TechnicalAnalysis #RangeConsolidation #BinanceSquare #加密货币