#هل Is the market really ready to explode, or is it just a boring bounce before sinking? Traders in SUI are wondering: Is breaking 0.8750 USDT a real buy signal or another liquidity trap? 🤔
It is impossible to accurately identify peaks and troughs, but what can be monitored are the better risk/reward areas. Currently, the struggle is over how well the support at 0.86–0.87 USDT can withstand negative liquidity pressure. At this level, patience and sticking to the plan are more important than predictions. ⚡
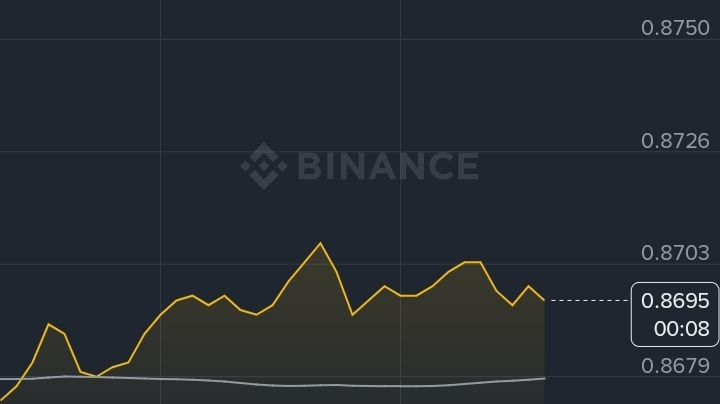
Price: SUI/USDT is trading near 0.8694 USDT after minor fluctuations of +0.01%. The moving averages between MA10 at 0.8683 and MA50 at 0.8686 reflect a delicate balance, and a breakout above 0.8750 will shift the short structure towards bullish.
Overall sentiment: The fear index at 10 shows excessive panic, while global news (oil up 41%) is pressuring overall liquidity.
Position distribution: The ratio of short-term traders to shorts at 3.4:1 clearly leans towards buying; professional accounts lean the same way at over 3.3:1.
Money flows: The net outflow over the last three days reached -2.27 million USDT, explaining the supply resistance near 0.88 USDT. According to Coinglass data, the neutral funding rate at 0.0001% reflects a cautious waiting state.
Breaking resistance at 0.8750: Two potential paths
📈 Scenario one: Breakout and bullish continuation | About 70% of traders lean towards this.
If you see the market ready for a technical breakout supported by market optimism towards AI integration in SUI contracts:
Fundamental logic: Positive momentum in the daily KDJ (K rising to 36 vs D = 31) indicates a potential rebound from oversold conditions.
Key levels: A sustained break above 0.8750 USDT could open the way to 0.8880 USDT and then 0.9050 USDT as potential profit-taking levels.
Trading tips:
Open a gradual buy position of 30% upon closing above 0.876 USDT with high trading volume.
Add an additional 20% after breaking above 0.888 USDT and confirming new support.
Stop loss below 0.862 USDT with a risk-to-reward ratio
less than 1:2.Who it's for: Traders able to take short risks and make quick decisions. This is a gradual momentum strategy that requires precise margin control.
📉 Scenario two: Failure to break out and a bearish reversal | About 30% of traders lean towards this.
If you believe that weak liquidity and risk aversion will curb any substantial rebound:
Fundamental logic: Losing momentum above the MA20 average at 0.8681 USDT indicates a likelihood of the price returning to the lower pressure range.
Staying below 0.8750 with a minor low under 0.866 USDT could push it towards 0.855 USDT and then 0.845 USDT.
Trading tips:
Enter a short position not exceeding 25% of your capital at the rejection candlestick.
Signal confirmation with a clear break below 0.865 USDT before expansion.
A strict stop loss above 0.879 USDT to maintain a positive risk/reward ratio.
Who it's for: Those who prefer to play defense and wait. This is a short hedge plan to preserve capital rather than chasing profits.
Which direction will you choose? A move above 0.8750 USDT might bring back a limited bullish sentiment, but breaking below 0.865 USDT would push us into a new wave of selling pressure. Are you more inclined to follow the momentum or do you prefer to sit on the sidelines? 😄