
First: Technical analysis of the chart
The general trend (hourly frame - 1h):
We notice that the price was in an upward wave that started from levels 0.0221 reaching a local peak at 0.0269.
After this peak, the price entered a downward corrective wave (a series of consecutive red candles), and is currently stabilizing around the level of 0.0238.
The key indicator here is the trading volume (Volume); we notice that the trading volume during the recent rise (the large green candle) was very high, while the trading volumes during the corrective drop were low and decreasing. This indicates that the drop may be temporary for liquidity gathering (retest/correction) and not a reversal of the trend.
Support and resistance levels:
Strong current support: The area between 0.0235 - 0.0238 is considered a technical and psychological support zone, where the price has previously bounced before the price explosion.
Nearby resistance: The level 0.0250 is the first resistance area that the price will face if it returns to rise.
Long-term target (main resistance): Peak 0.0269 which represents the final target for the current wave.
Moving averages (MA):
The price is currently testing the moving averages (the colored lines below the price), which adds strength to the current support area as it is a 'touch to moving support'.
Secondly: Conclusion of the potential trade (Strategy)
The most likely scenario is a bullish rebound from the current support levels, supported by low trading volume during the correction and the price's position above the averages. Based on this, the trade is designed as a buy (LONG):
Type of trade: Buy (Buy/Long) when touching support.
Proposed entry point: 0.0236 - 0.0239 (the current price is very suitable).
Targets:
First target (TP1): 0.0250 (quick profits).8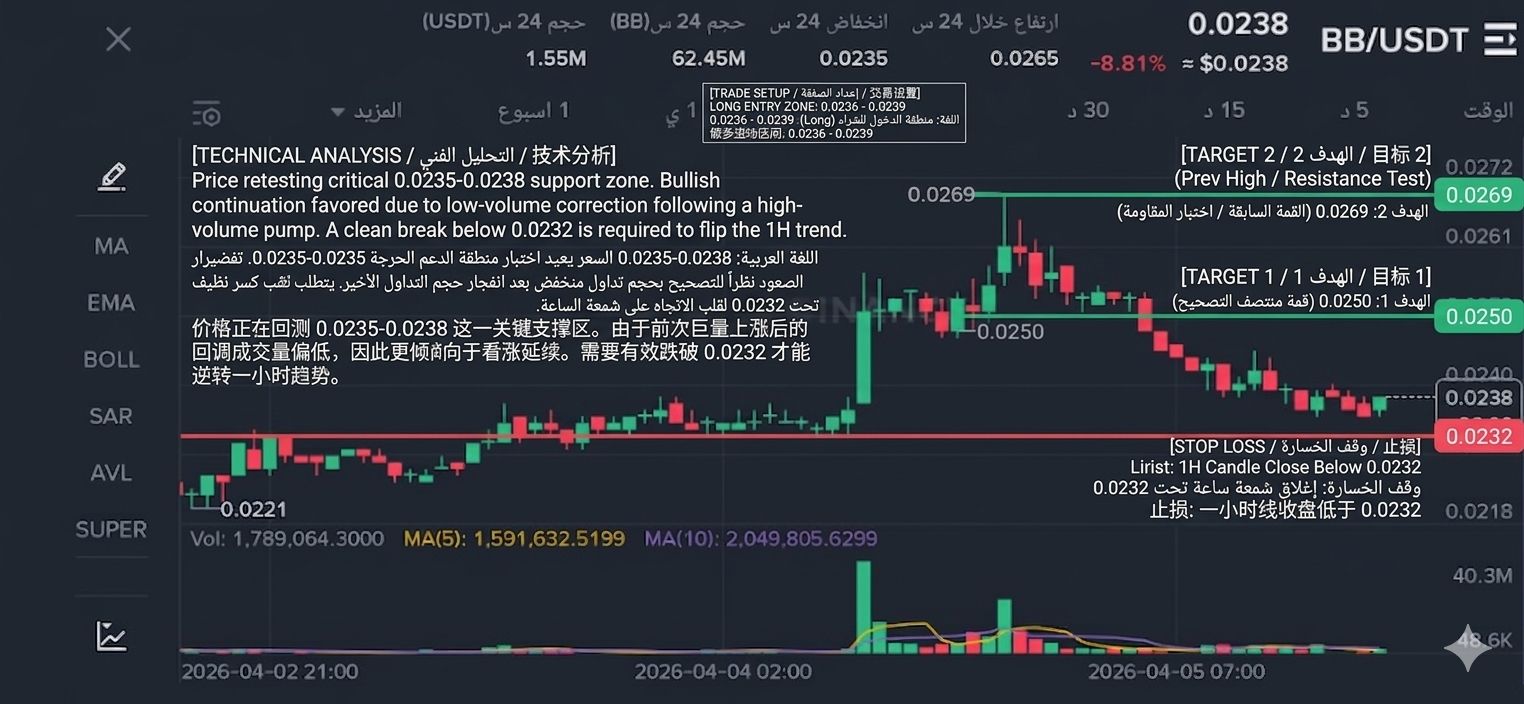
Second target (TP2): 0.0269 (testing the previous peak).
Stop Loss: Closing a one-hour candle below the level of 0.0232 (because a break below negates the idea of rising $TRU $CTSI