
In 2020, Musk single-handedly controlled Dogecoin, and a single tweet could send it soaring. In the past two years, Trump has directly controlled the entire financial market; a positive news can cause U.S. stocks and the cryptocurrency market to surge, while a negative news can cause a sharp drop. Back then, I thought Musk was already a top player, able to manipulate a single cryptocurrency; now I understand that presidential-level influence is a dimension-reducing strike -- the rise and fall of the global market is all in his words.

The world's understanding of Trump is still less than 5%. Just yesterday, he threatened to destroy Iran, but today he reached a ceasefire agreement -- saying Trump himself didn't place many orders is becoming less credible.
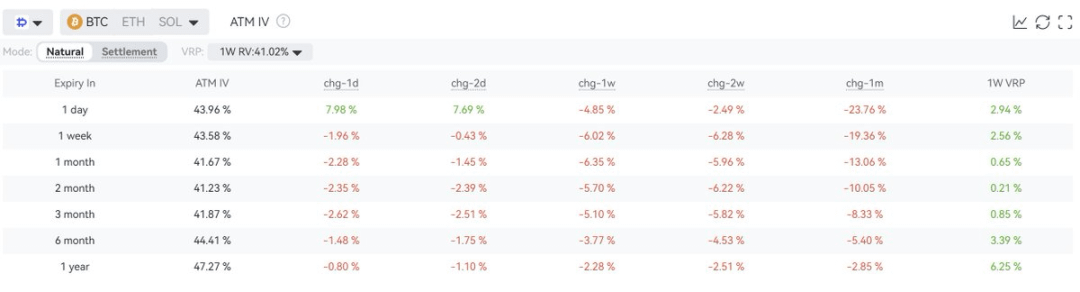
Bitcoin quickly soared to 72K, but the implied volatility (IV) of major near-term options is still declining; even near-expiry options are sliding. The negative skew decreased as prices went up. Meanwhile, due to the rise in actual volatility (RV), the volatility risk premium (VRP) from yesterday's sharp rebound has dropped again.
From key options indicators, the rebound above $70,000 has clearly boosted market sentiment, mainly by easing fears of a black swan event causing a crash, rather than reflecting expectations for a sustained price increase.
The ceasefire talks between the US and Iran have propelled Bitcoin upward, essentially driven by short-term positive news rather than genuine market buy-side demand. There is a fundamental difference between the two. Hence, this rally is unlikely to have sustaining momentum unless this event becomes a pivotal turning point. A rebound purely driven by news cannot be compared to a rise propelled by the crypto market's own fundamentals.
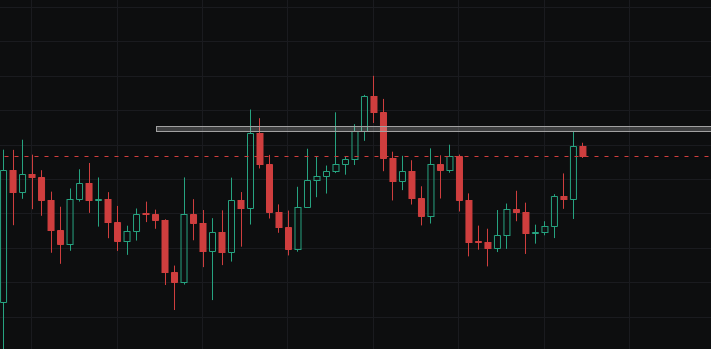
Bitcoin's four-hour chart shows weak buying and selling pressure; both sides are fiercely contesting. The daily head-and-shoulders pattern remains valid -- left shoulder at 73,000, head at 76,000, right shoulder at 71,000-72,000, and neckline at 60,000-62,000. Today's trading strategy is to scale into shorts between 71,000 and 72,000.
April 10th's CPI is the real bombshell; oil prices have broken $115, with over a 70% chance of CPI exceeding expectations. Once the data drops, prices are likely to accelerate downward, potentially triggering the 5th wave of the weekly downtrend. After a 59-day consolidation, the weekly 4th wave dead cat bounce is about to face a trend change. Even if it oscillates for a few more days, it’s unlikely to alter the medium-term downtrend direction. The first target for this medium-term downtrend is 65,000-66,000, the second target is 60,000-62,000, and the ultimate target is 40,000-45,000.
True investors ⬇
Always pursue stability and long-term gains.
Never chase high-frequency, hype-driven, gambling-style trades.
In a month, or even a few months, I might only take one trade.
Whales, middle-class, rich folks. Never get emotional, just use rationality. Analyze logically, then position accordingly.
Want to stay ahead with structural analysis, key levels, and wave strategies without falling into trap? Join my study group! Daily shares include: technical structure explanations, key position analysis, position risk control, real-time strategy alerts, and various trading tips. The market is risky; trade with caution.
The above content is just personal thoughts shared, not investment advice; trading based on this is at your own risk.