*The indicator that everyone sees and few understand* 📊
---
I honestly admit:
MACD has long been on my chart — present but ignored.
I saw lines moving and bars rising and falling.
I vaguely understood that it's something about momentum.
But the combinations DIF, DEA, MACD — remained a mystery.
Today we unravel the mystery together. Step by step. 🎯
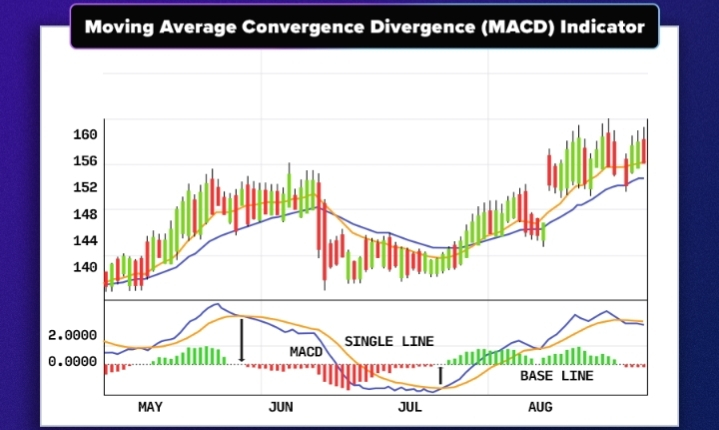
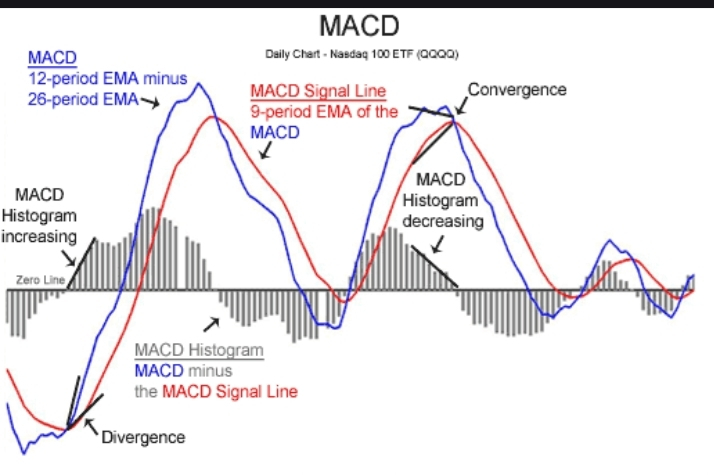
**What is MACD — the 3 components**
MACD is not a single indicator. There are three components that work together:
**DIF — the fast line**
Calculates the difference between EMA12 and EMA26.
React quickly to price changes.
It's the yellow line on your chart.
**DEA — the slow line**
The moving average of DIF over 9 periods.
Reacts slower — filters out noise.
It's the pink/purple line on your chart.
**MACD — histogram**
The difference between DIF and DEA.
Represented as green and red bars.
Shows the strength and direction of the momentum.
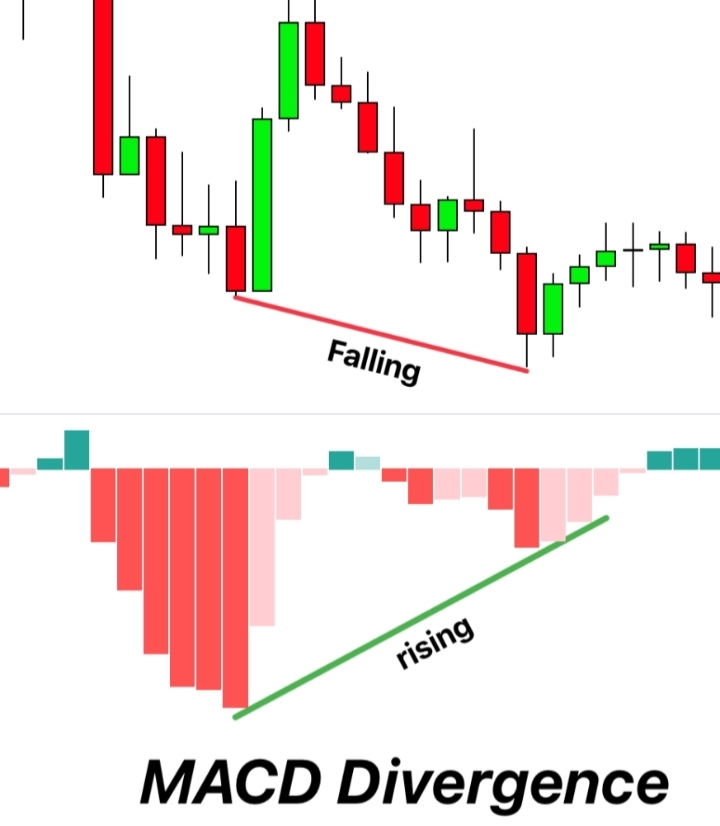
**How to read the histogram**
The bars are the most visual element of the MACD:
🟢 **Green bars above zero** = bullish momentum
- Increasing green bars = bulls gain strength
- Decreasing green bars = bulls are weakening
🔴 **Red bars below zero** = bearish momentum
- Increasing red bars = bears gain strength
- Decreasing red bars = bears are weakening
**Simple rule:**
It's not just the color that matters — it matters whether the bars are rising or falling. 🎯
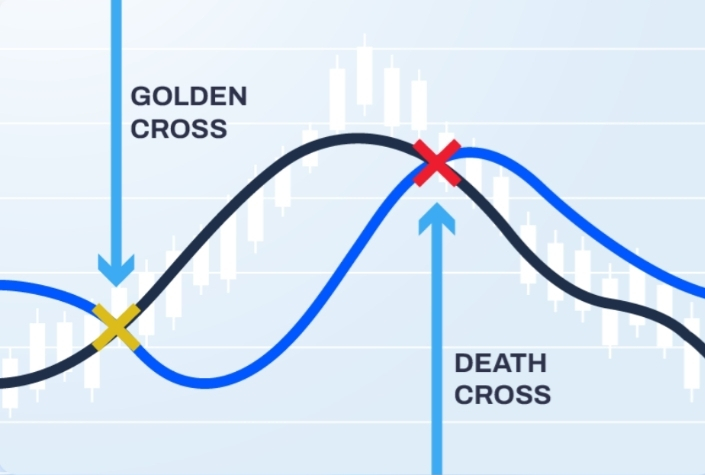
**Golden Cross and Death Cross**
Here is the real MACD signal:
**Golden Cross** 🟢
DIF crosses DEA **from below.**
Bullish momentum exceeds the slow average.
Classic buy signal.
**Death Cross** 🔴
DIF crosses DEA **from above.**
Bearish momentum exceeds the slow average.
Classic sell signal.
**When MACD deceives you**
MACD is not perfect. It has two important limitations:
**1. Lagging indicator**
MACD calculates data from the past.
It confirms what has happened — not what will happen.
The signal sometimes comes after the movement has already begun.
**2. Sideways market**
In consolidation — MACD frequently generates false signals.
Golden Cross and Death Cross succeed each other rapidly without a clear direction.
In a sideways market — Bollinger and StochRSI are more useful.
**How I use it practically:**
I do not use it for entry and exit — for that I have Bollinger and StochRSI.
I use it for **context:**
Positive MACD + price above MB = confirmed bullish trend.
Negative MACD + price below MB = confirmed bearish trend
DIF is divergent from price = caution, possible reversal
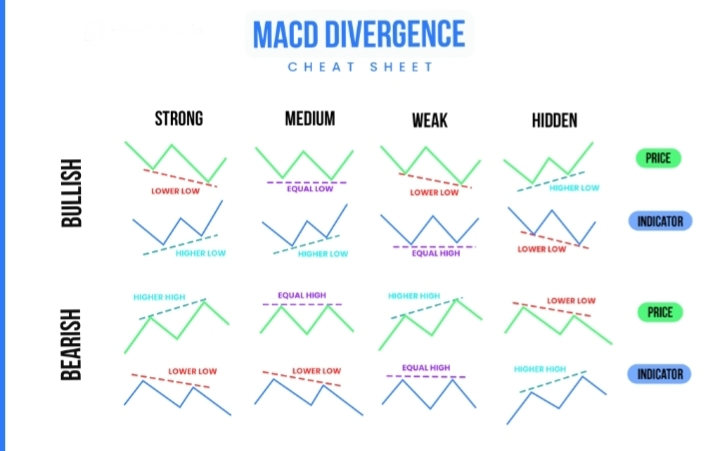
**Divergence** is the strongest MACD signal:
Price makes a new high — MACD does not confirm = signal of trend weakening. ⚠️
---
**Conclusion Ep. 2.4:**
MACD is not a mystery — it's a conversation between two moving averages.
DIF and DEA track each other.
When they meet — the market makes a decision.
The histogram shows you how much conviction there is. 🎯
Alone — MACD is useful but slow.
Together with Bollinger and StochRSI — you have a complete system.
---
*In Ep. 2.5 we will talk about RSI —*
*the relative strength indicator that tells you when the market is too tired to continue.* 📊
---
🔖 #BinanceSquareTalks #BinanceAcademy #BinanceSquareFamily #NexusBull #Romania $ETH $BNB