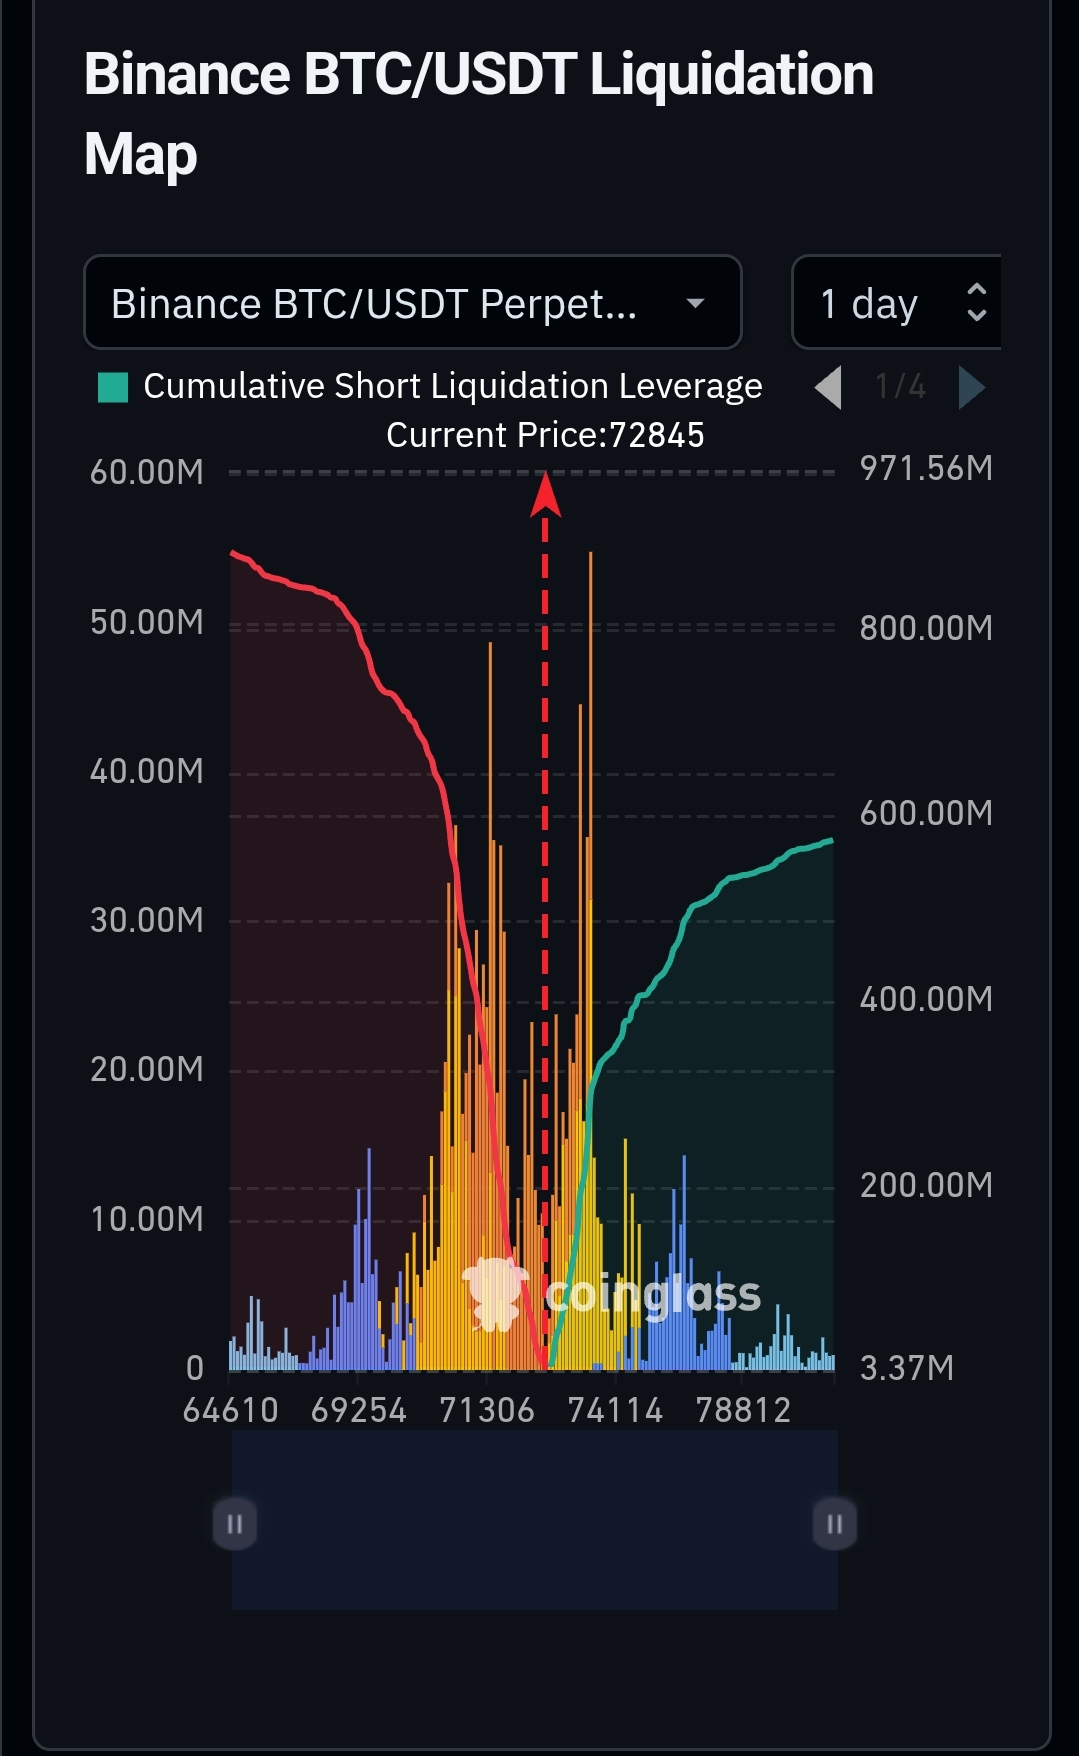
This chart is a 1-day Liquidation Heatmap for Binance BTC/USDT Perpetual Futures, showing cumulative short liquidation leverage. The price of BTC is at $78,845 and a large short liquidation cluster is seen nearby.
Detailed analysis of the chart
In this heatmap, the X-axis represents price levels from $64,610 to $78,812 and the Y-axis represents cumulative short liquidation volume (from 0 to 60M). According to fresh data, the current price of BTC is around $71,000-$72,000, which has passed through the nearby levels of the chart. Lower levels ($64k-$69k): fewer liquidations in blue-green, suggesting support zones. Medium ($70k-$74k): yellow-orange spikes, where long squeezes occurred. Upper ($74k-$78k+): red-yellow spikes and a large green cluster (~$91M) near the current price, indicating a large area of short positions. The chart shows that recently the price dropped from $91k to $78k, where long liquidations increased, but now the upper short clusters (around $78k-$91k) indicate the potential for a short squeeze.
Market implications
This heatmap shows liquidity traps: lower downside risk from fewer long liquidations below, while a significant push may come from shorts above. According to fresh data, BTC has recently stabilized around $71k to $72k, showing a bounce past the mid-zone of the chart. An increase in short liquidations could lead to an upward price cascade, especially if $78k breaks.
Price forecast Short-term forecast:
An increase to $74,500-$76,000 is possible, followed by a pullback at $72k. In the medium range, by the end of 2026, $98,000 (base case), bull $132k or bear $52k.
The upward bias is due to the short clusters on the chart, but keep an eye on $70k support due to volatility.
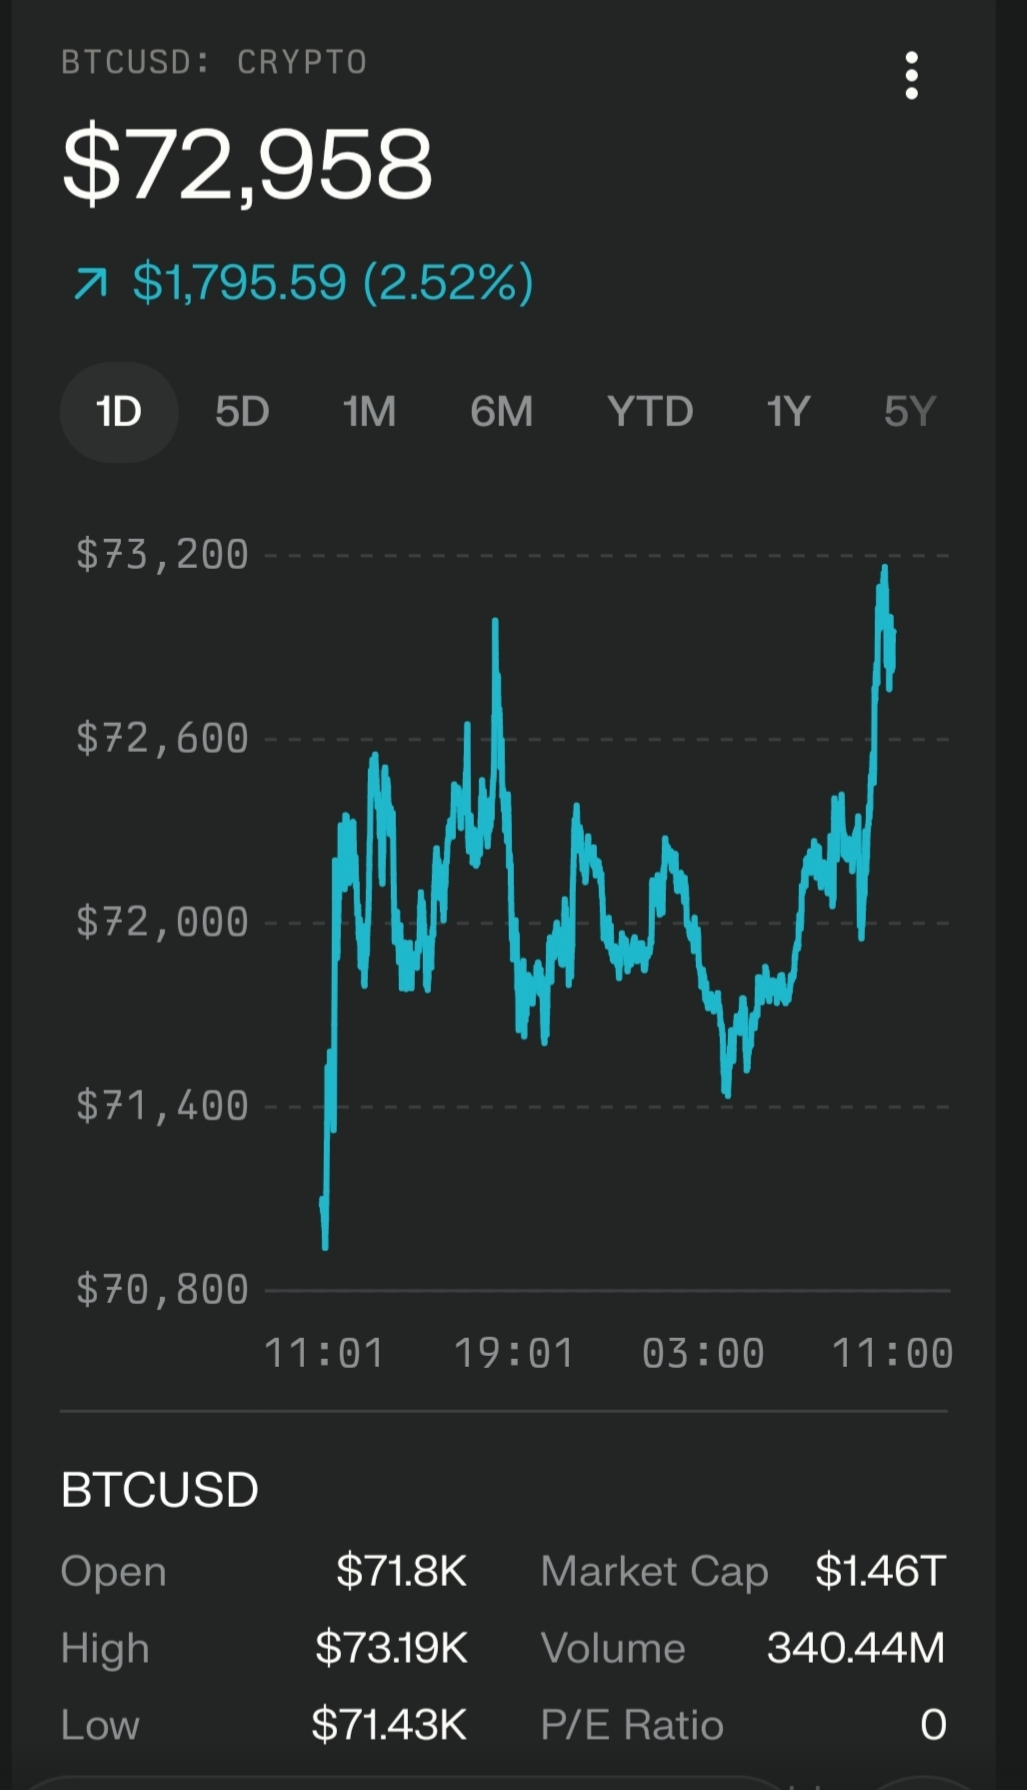
The current price of Bitcoin is approximately $72,960 USD, which is between the day's low of $71,431 and high of $73,194 based on fresh data. Based on this chart and market trends, the upcoming support and resistance levels are as follows. Upcoming support levels on the downside are the key supports below, which appear strong due to fewer clusters in the liquidation heatmap: First support: $71,400 - today's day's low and near the 50-day moving average (~$68,875). Second support: $69,250 - near the middle green-yellow spikes on the chart, where long liquidations are low. Key support: $64,600 - the chart's lowest price level, where protection may be found from fewer liquidations in blue. If these levels break, pay attention to $60,000 (year's low).
Upcoming resistance levels
Resistance is strong due to the upper short liquidation clusters, which could lead to a squeeze: First resistance: $73,200 - today's day's high and near the chart's level of $73,060. Second resistance: $78,000-$78,800 - the current red arrowed cluster on the chart (~$91M shorts), where a significant push could occur. Key resistance: $91,500 - a large green cluster above, which opens the road to $98,000 if broken. Strategic advice The chart shows bullish momentum from the upper short clusters, but keep an eye on $71,400 support. If $73,200 breaks, consider a long position, otherwise wait at $70,000.
Strategic advice
This liquidation heatmap gives bullish signals as there are large short positions in the range of $78k to $91k, which will get squeezed and push further up if the price goes above. However, if it breaks below $71,400 (the day's low), the downside risk will increase, so a stop-loss is necessary. For a long strategy, enter at $72,000 to $72,500, target $78,000 (first short cluster) and keep a stop-loss at $71,200, which gives a 1:3 risk-reward. For a short strategy, enter short if a rejection is seen at $73,200, targeting $70,000 and stop at $73,800, but this is less likely due to the current bullish bias. Risk management should only risk 1-2% of capital and do not use leverage over 3x. Scale in and scale out due to volatility, and always do your research by checking fresh market data.