Based on the technical analysis of the image, the determination of entry and exit points depends on the investor's strategy, but the data from the chart suggests the following:
Entry Moment (Retrospective Analysis)
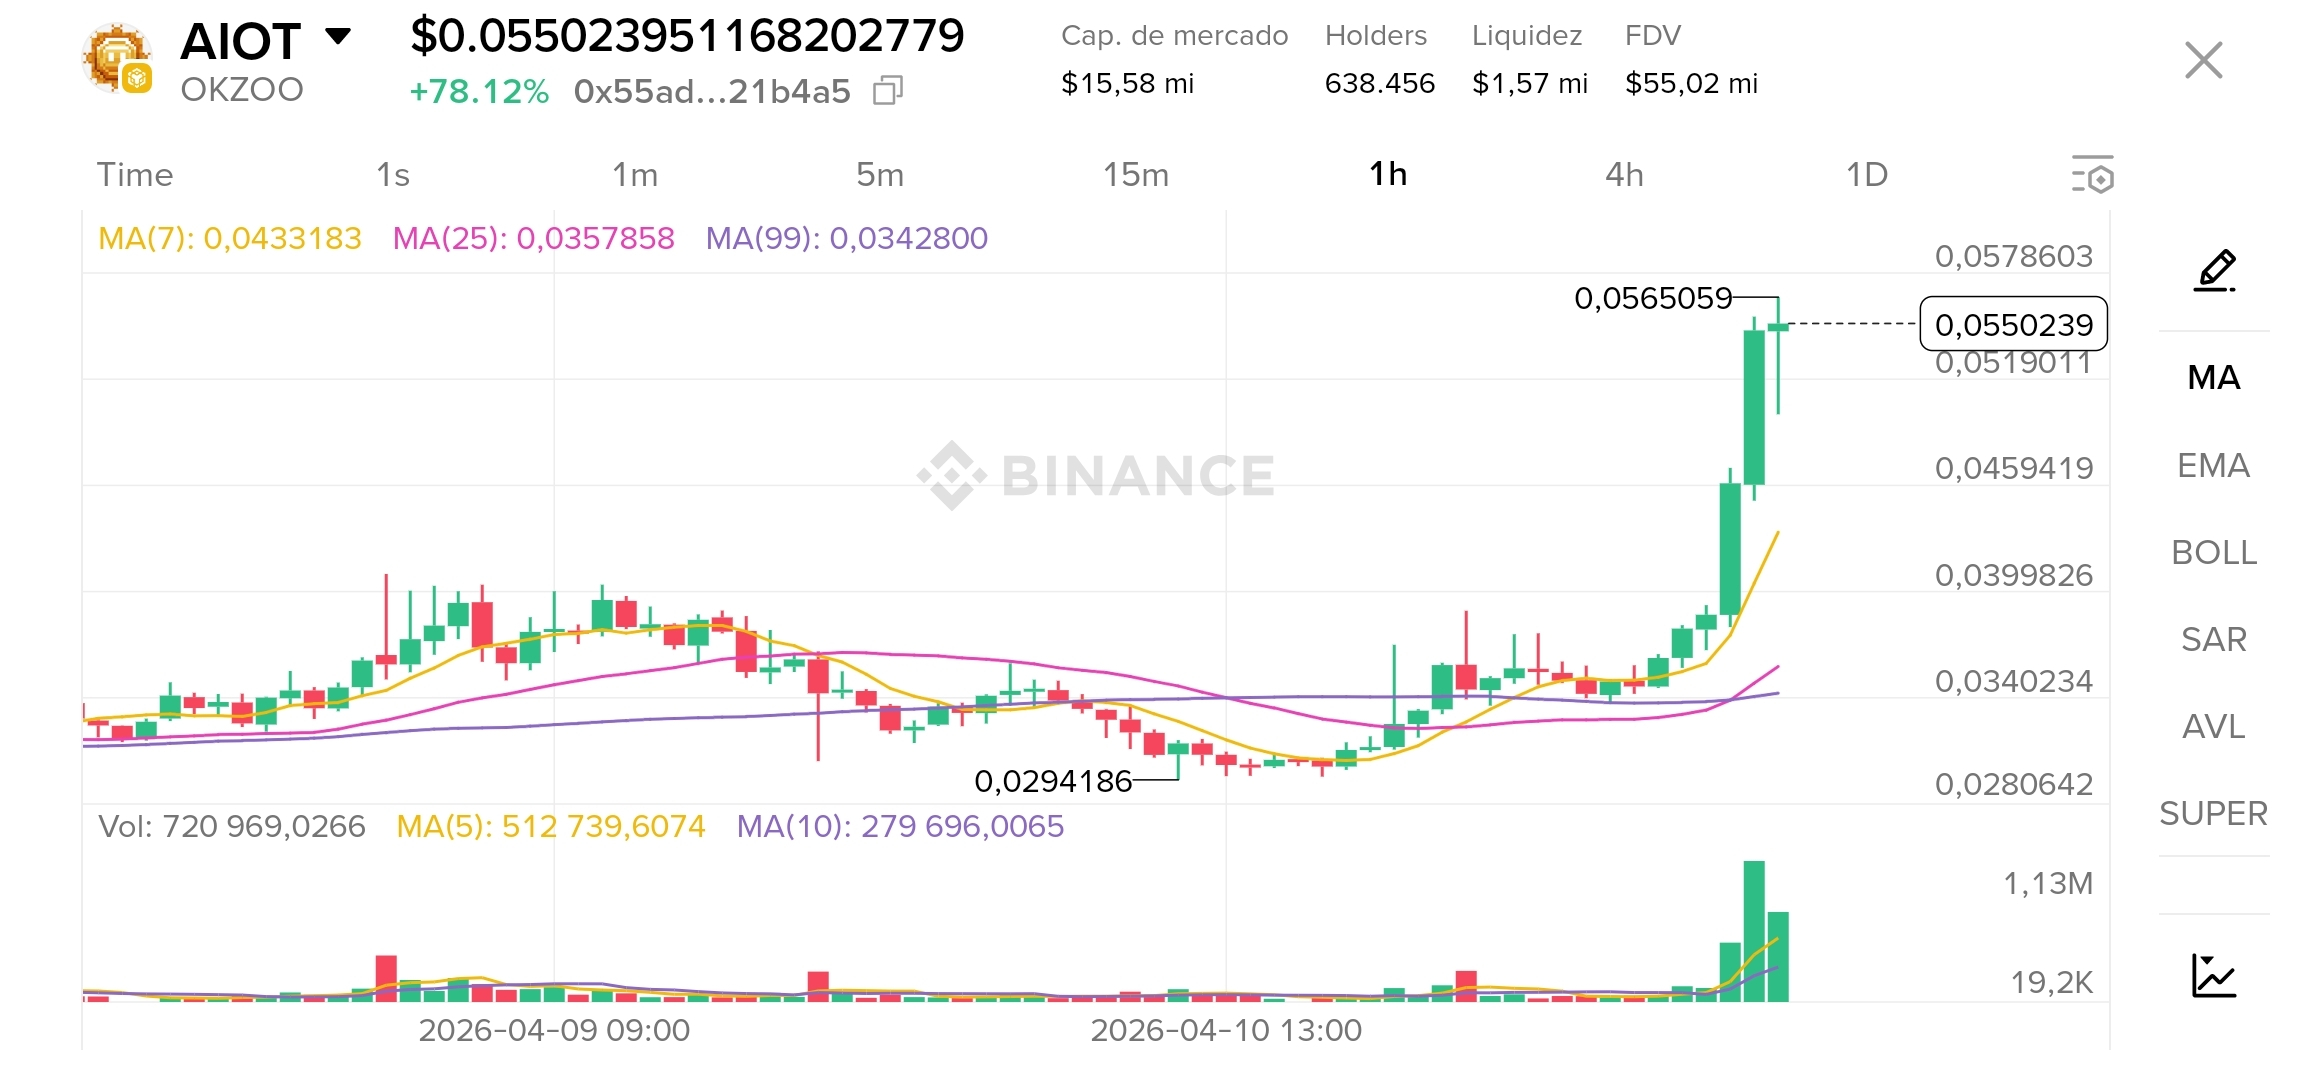
A technical entry point would have occurred when the price broke through the previous consolidation zone and crossed above the Moving Averages (MA).
Breakout Signal: After the price reached the low of 0.0294186 on April 10, there was an increase in volume and the price surpassed the yellow lines (MA 7), pink (MA 25), and purple (MA 99).
Alignment of Averages: The moment when the MA(7) crossed above the other averages indicated the beginning of a strong upward trend.
Exit Moment (Current Situation)
The chart shows that the asset (AIOT) had a sudden appreciation of +78.12%, reaching the current value of $0.0550239.
Price Extension: The price is currently very far from its moving averages (MA 7 is at 0.0433 and MA 25 at 0.0357). Historically, when the price strays too far from these support lines, the likelihood of a correction or "profit-taking" increases.
Proximity to the Top: The price is close to the recent high of 0.0565059. For a short-term trader, this level of vertical stretching is often considered a point to think about exiting or protecting profits, as the movement is parabolic.
Attention: This analysis is based exclusively on the technical indicators visible in the provided screenshot and does not constitute financial advice.
$AIOT #AIOTUSDT #AIOTUSD #AiotToMoon #AiotToMoon #AIOTToken #AIOTupdate