
Recently, this coin RAVE has left everyone dumbfounded.
From the low point in March of $0.206 all the way up to $2.35, a 30-day increase of 872%, with the most intense day seeing a single-day increase of 216%.
Today it even reached 3.2.
This is obviously a manipulation.
So today we will break down how the manipulators operate and how to catch manipulated coins.
1. First, look at the timeline of RAVE's price manipulation.
On February 11th, RAVE was listed on Coinbase, which was the first key point.
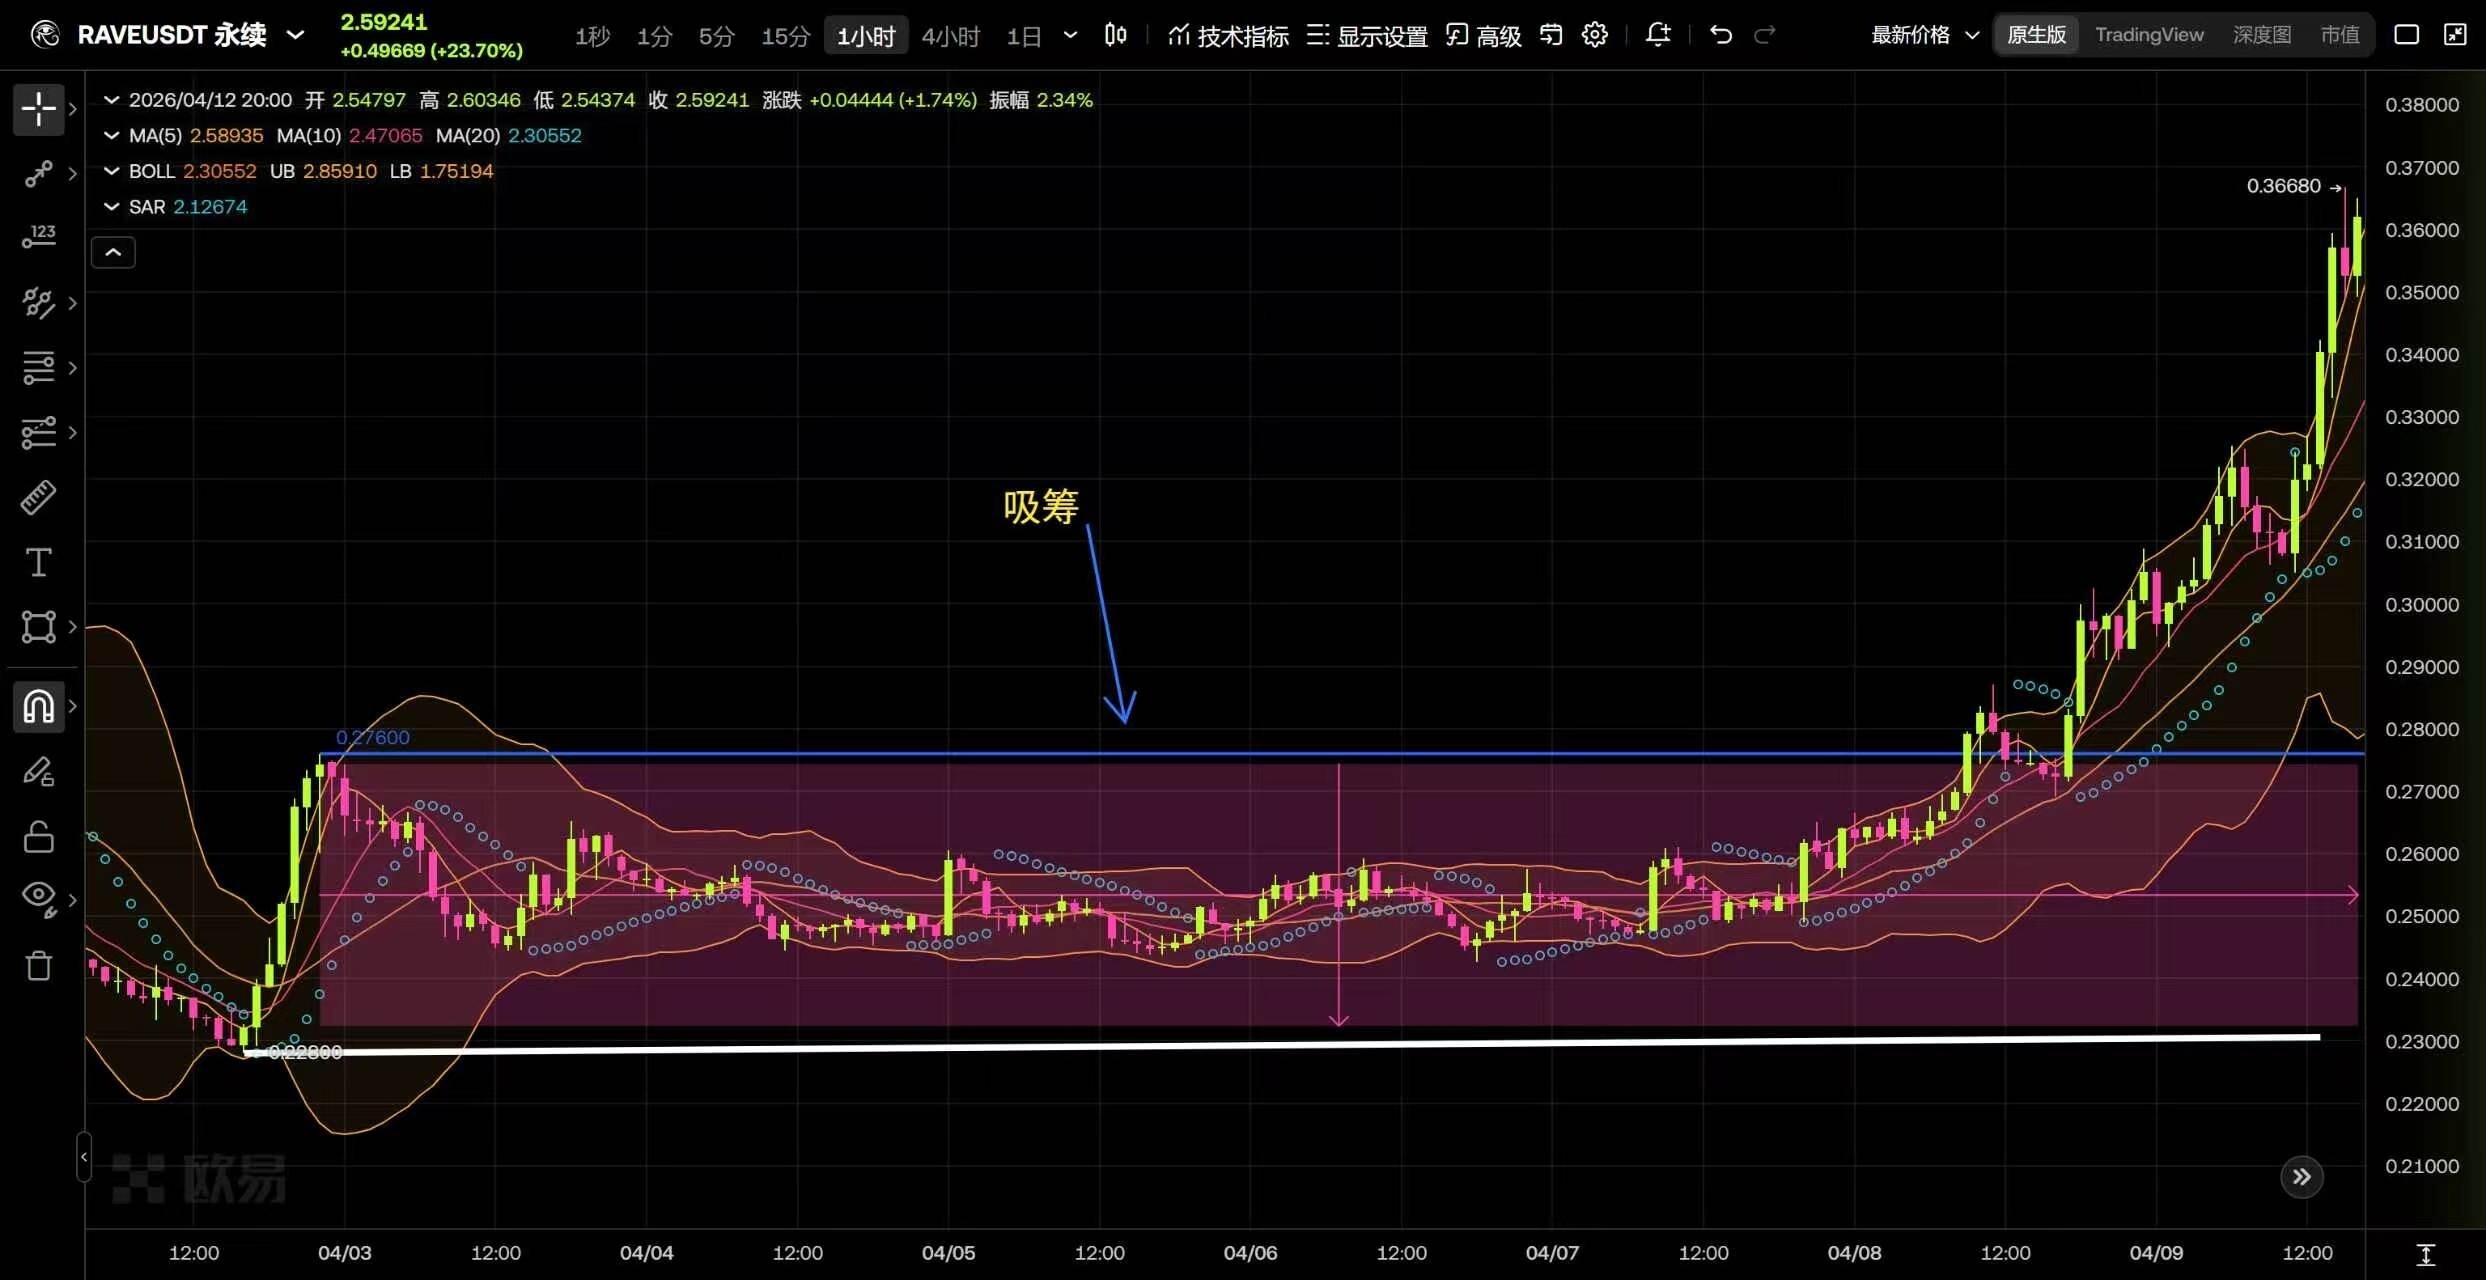
After going up, the price slowly grinded from a low position, and during this stage, the manipulators did one thing—accumulated shares.
On-chain data shows that on February 22nd, a large address (starting with 0xff6a) withdrew 10 million RAVE from Bitget in one go, worth 6.56 million USD, and it was done 3 hours before a major announcement.
At this point, clues can begin to emerge.
Immediately following that wave in February, RAVE surged 80% in a week, jumping from a low to around $0.90.
Daily trading volume exploded to $86 million, accounting for 69% of the total market capitalization. On the contract side, it's even more exaggerated, with futures trading volume at $277 million and spot trading only at $13 million—contracts are 21 times the spot.
OI (open interest) increased by 29% to $46.7 million.
The dealer uses contract leverage to push the price up; the spot chips haven't really moved.
Then in March, the price corrected to around $0.20 and consolidated, leading many to believe it was done.
But actually, this is also part of the accumulation. On-chain data shows that during this period, there has been a continuous net outflow from exchanges, and the dealer is quietly accumulating.
An OTC whale sold 900,000 RAVE at an average price of around $0.25 during this phase, netting $229,000, basically breaking even.
What happened? After he sold, RAVE skyrocketed 226% 21 days later; those 900,000 coins would have been worth $870,000 if held, missing out on a $640,000 profit.
This guy has $440 million in ETH and $296 million in cbBTC, but ended up taking a big hit on RAVE.
The core contradiction is just one: he treats RAVE as a short-term chip, but the dealer doesn't want him on board; he probably wouldn't have let it rise like this if he hadn't sold.
Early April, just a few days ago, was the real main wave. RAVE rose from $0.32 to $0.96 in one day (200%), then continued to surge to $1.26 (500%), and then to $1.50 (216% in a single day), finally peaking at $2.35.
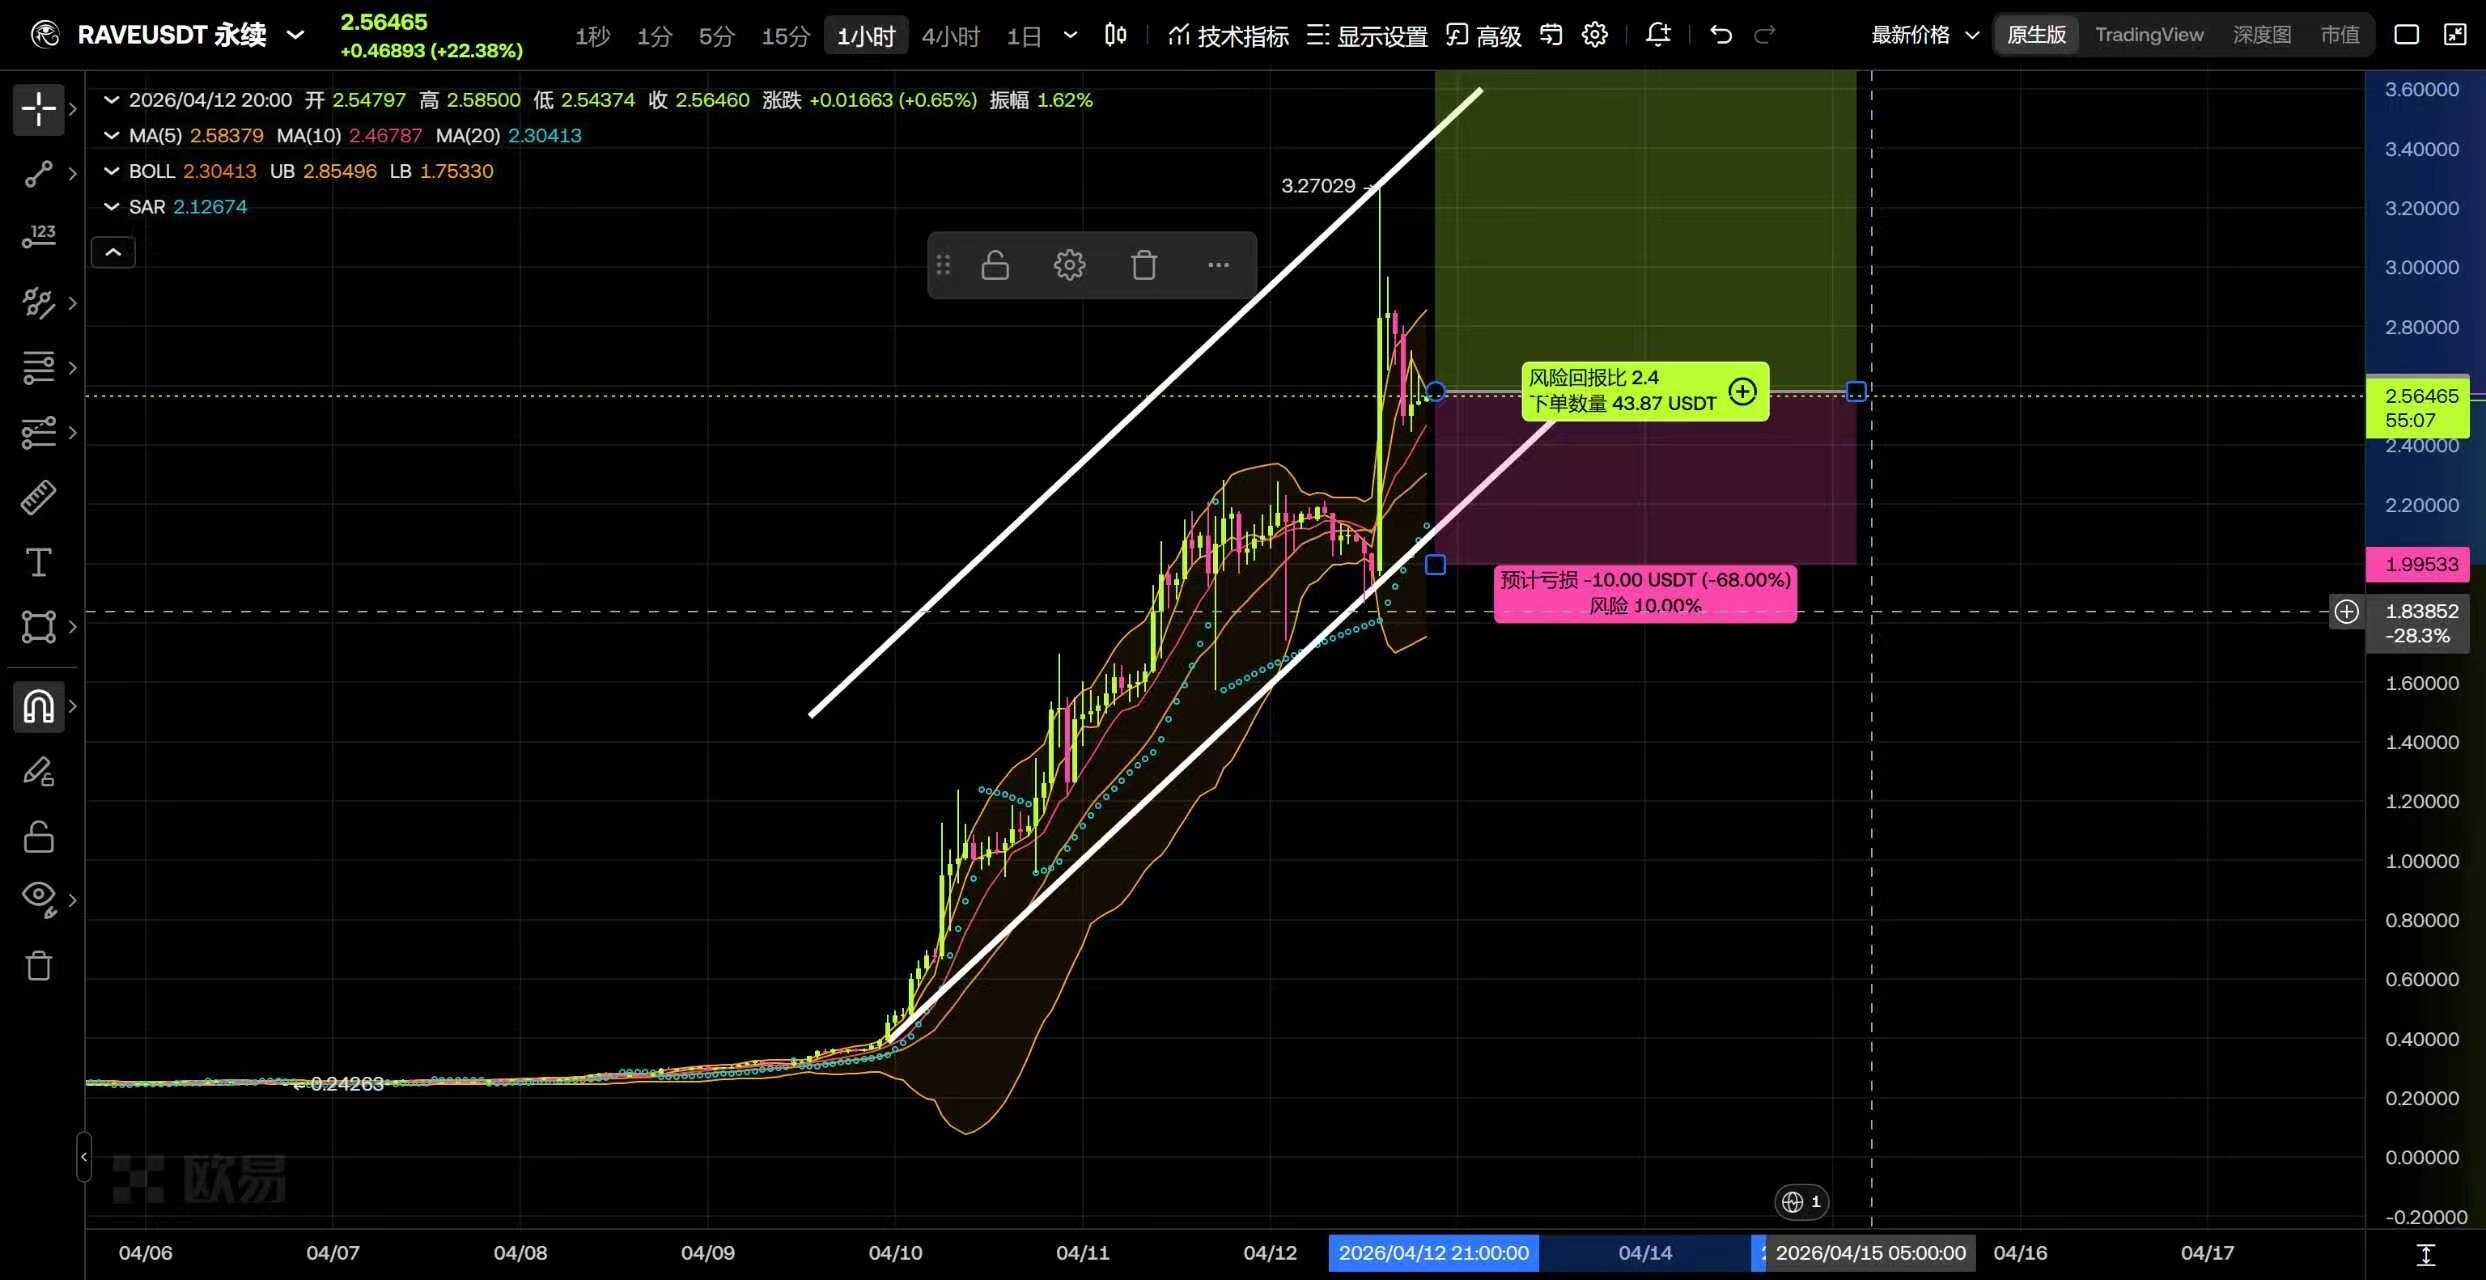
OI soared to $250 million, with contract positions exceeding $130 million. Throughout this process, the trading volume's market cap ratio once reached 78.5%, a figure that is almost impossible to see in normal coins.
2. Analyzing the dealer's trading strategies
Breaking it down makes it clear: the RAVE dealer uses a classic 'low circulation + contract control' model:
1) Control the chip structure: RAVE has a total supply of 1 billion coins, with only 239 million in circulation, accounting for 23.9%. 76% of the chips are locked up or in the hands of insiders.
With such a small circulating supply, the dealer only needs to control several tens of millions of dollars worth of chips to drive up the price.
2) Withdrawing coins from exchanges creates scarcity: Before a price surge, a large number of tokens are withdrawn from exchanges to reduce the depth of sell orders.
On-chain data is clear; there have been significant net outflows from exchanges before every major rise.
3) Contract leverage amplification effect: Futures trading volume is more than 20 times that of the spot, and OI has piled up from 46.7 million to 250 million. The dealer builds long positions on the contract side while pulling up the price on the spot side, forcing shorts into a squeeze that turns into buying fuel, creating a short squeeze spiral.
4) Insiders lay out in advance: Two related insider wallets deposited 18.58 million RAVE to Bitget 48 hours before the surge, worth about $8 million. They say "long-term holding," but their hands are all preparing to lay out an exit channel.
5) Social media collaboration to create momentum: On-chain analysis shows that 67% of social media discussions come from wallet addresses that had already built positions 3-7 days prior. Buying first and then shouting is the standard prelude to a dealer's exit.
3. How can retail investors catch the dealer? Practical methodology
Core Logic: You don't need to be smarter than the dealer; you just need to discover what the dealer is doing before other retail investors.
1) Monitor net outflows from exchanges: Use on-chain tools like Arkham, Nansen, or DeBank to monitor the net outflow data of the target coin on exchanges. If there are net outflows for more than 3 consecutive days and the amount of a single withdrawal exceeds 1% of the total circulation, there is a high probability that large funds are accumulating. RAVE has this signal every time before a price surge.
2) Look at the divergence between OI and trading volume: If the spot trading volume hasn't increased much but OI and contract trading volume have surged, it indicates that someone is using leverage to build positions.
RAVE's contract/spot ratio reached 21:1; this extreme ratio is solid evidence that the dealer is present.
Channels like BWE_OI_Price_monitor can monitor OI changes in real time; special attention should be paid when the price remains unchanged but OI surges sharply.
3) Focus on low circulation, high lock-up coins: Coins with a circulation ratio below 30% are naturally suitable for control.
RAVE has only 23.9% in circulation, giving the dealer a huge operational space. Once this type of coin starts, the price often rises several times because there are simply not enough sell orders; you must dare to chase the rise.
4) Track insider wallets: Use Arkham to label known project parties and early investors' wallets. Sending coins to exchanges is a warning signal (preparing to sell), while withdrawing from exchanges is a positive signal (preparing to hold). Those two insider wallets for RAVE deposited 18.58 million coins to Bitget, and after 48 hours, they started to pull up the price; this is laying out a plan for selling at a high.
5) RSI overbought is not a sell signal, but a confirmation signal: Many people want to short when they see RSI over 90, but in coins controlled by dealers, RSI can stay in the overbought zone for a long time. RAVE's RSI surged above 82 and then continued to rise several times. Overbought only indicates strong momentum; it doesn't mean a pullback is imminent. The real sell signal is when OI starts to decline and net inflows into exchanges increase.
The article is a bit long, and I will continue to elaborate in the next post.
$RAVE #美伊和谈未能达成协议