Core qualitative analysis of the market (multi-period resonance verification)
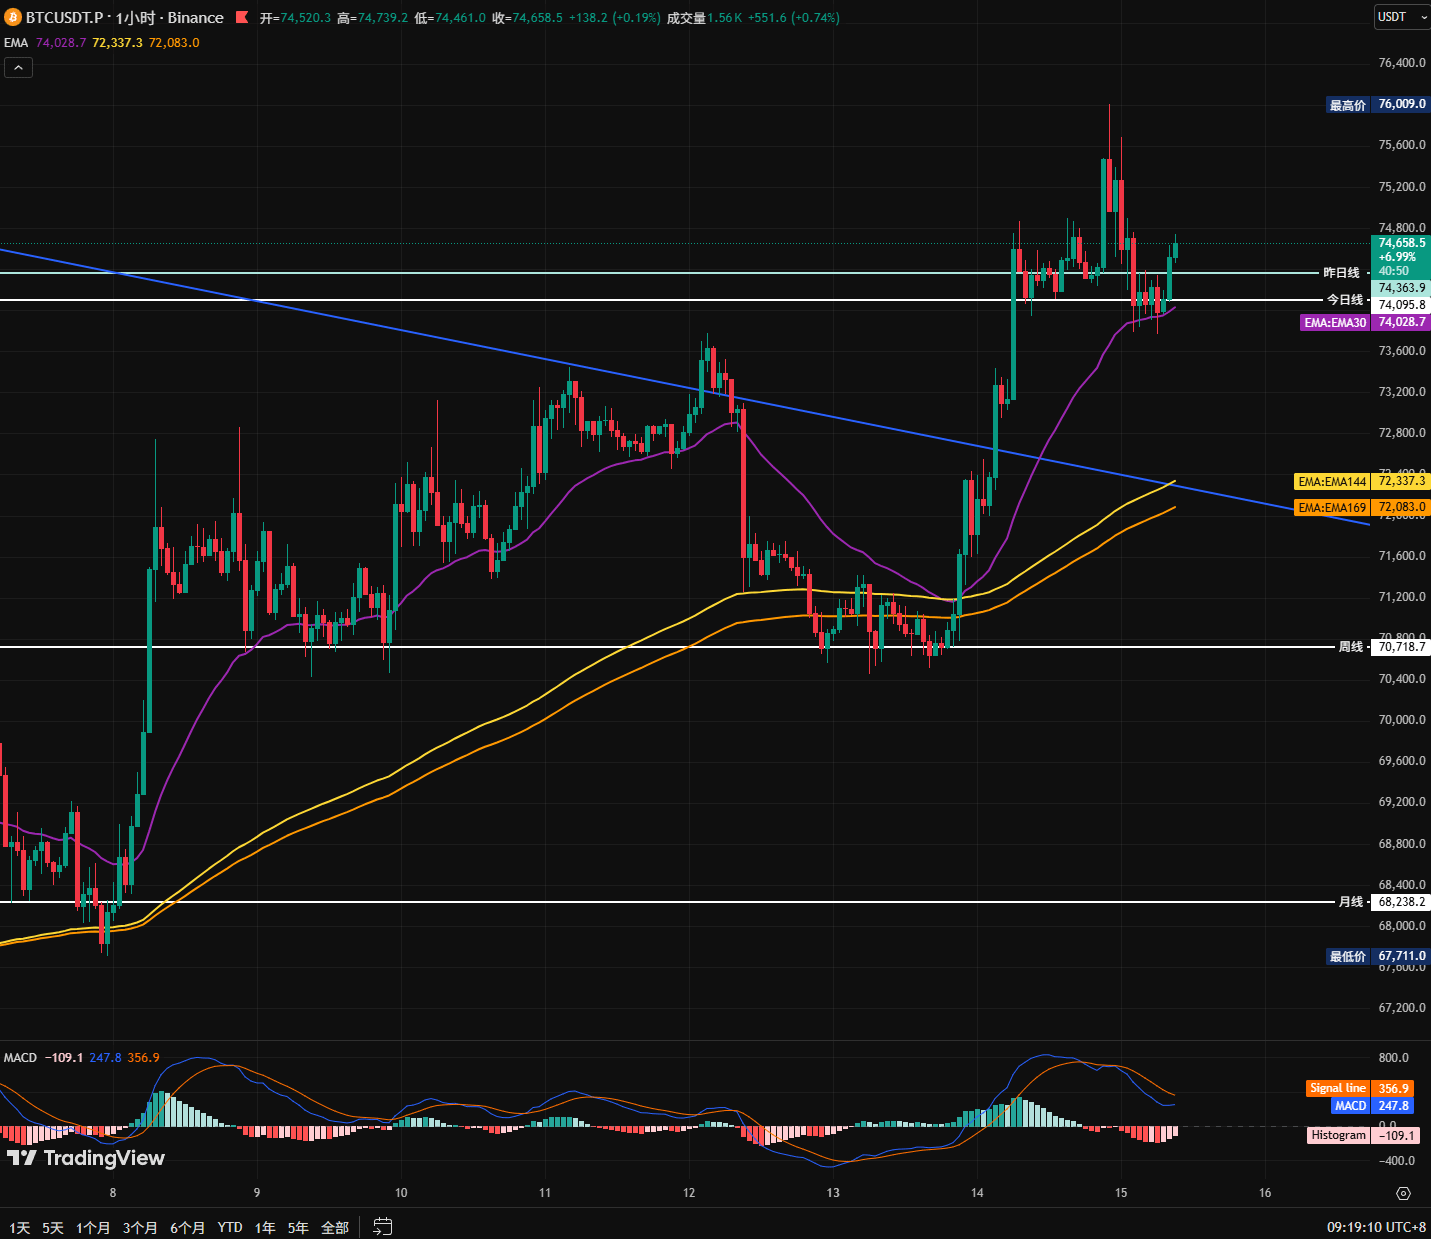
Current price$BTC ≈74517.5 USDT, fully resonating main long across multiple periods, in the high stagnation stage of the main long trend's 1-hour level pullback and 15-minute level rebound:
Core conclusion: The main long-term trend is irreversible, and the weighted average funding rate of positions being negative indicates that large holders are taking profits at high positions, not a trend reversal; there is a clear need for a short-term pullback at the 1-hour level, with the main strategy being to buy the dip on pullbacks, and short positions only as a light alternative when overbought or stagnant, with strict prohibition on chasing long positions at high levels.
1. Multi-dimensional in-depth verification of the market
1. Trend Structure (Dow Theory + EMA, multi-timeframe resonance)
Daily: EMA30 and EMA144/169 are diverging upwards, price firmly above both EMAs, clear main bullish trend, no reversal signals; the bottom continues to rise, completing the structure for the main uptrend after the bear market, strong trend continuation.
4-hour: dual EMAs trending upwards, price firmly above both EMAs, main bullish structure is healthy, quick rebound after pullback, no breakdown signals, main bullish trend is irreversible.
1-hour: dual EMAs trending upwards, price firmly above both EMAs, clear main bullish trend; failed to break 76009 previous high, high-level stagnation, MACD death cross with green bars indicates clear 1-hour level pullback demand, merely a normal correction within the main bullish trend.
15-minute: dual EMAs trending upwards, price firmly above both EMAs, 15-minute level rebound, MACD golden cross with red bars, indicating a weak rebound within the 1-hour pullback, no reversal signals.
2. Volume-Price Relationship
Rally phase: from low of 67711 to previous high of 76009, accompanied by a strong long bullish candle, market demand completely dominates, Wyckoff 'accumulation - markup' structure is complete and healthy.
Current stage: failed to break previous high, high-level volume shrinking (1-hour trading volume < 30-day average), buy support weakening, candlestick bodies shrinking, typical signal of 'demand phase decay, bullish momentum weakening'; clear demand for pullback on the 1-hour level; no high-volume long bearish distribution at peak, main bullish trend remains intact, merely a normal correction after profit-taking.
3. Large Holder Capital Situation
Weighted average funding rate ≈ -0.0108 (negative): weighted by large holders' positions, a negative rate means shorts are proactively paying funding to longs, indicating large holders are concentrating on shorting and taking profits at high levels, which is normal position reduction in a main bullish trend, not a trend reversal; overall net long positions remain positive (28.898K - 14.176K = 14.722K), large holders are still net long with no large-scale shorts exiting.
Large holders' long-short ratio 0.8650 (<1): large holders have slightly more shorts than longs, clear reduction in positions at high levels; long-short trader count ratio 0.6990 (<1): retail short trader count exceeds longs, typical 'large holders reducing positions at highs, retail shorting' healthy structure, no 'whales distributing, retail buying' high-risk scenario.
Overall cycle net long positions are positive, large holders' willingness to go long remains unchanged, merely profit-taking at high levels, supporting the continuation of the main bullish trend.
4. Momentum Indicators (supportive validation)
RSI: daily 62.01, 4-hour 63.42, 1-hour 65.87, 15-minute 57.18, neutral to slightly bullish across the cycle, 1-hour RSI nearing overbought, clear pullback demand, no extreme overbought overheating.
MACD: daily, 4-hour, and 15-minute golden crosses with red bars, only 1-hour has a death cross with green bars, indicating sufficient bullish momentum in larger cycles, only the 1-hour level shows pullback demand, main bullish trend remains intact.
$BTC #加密市场回暖