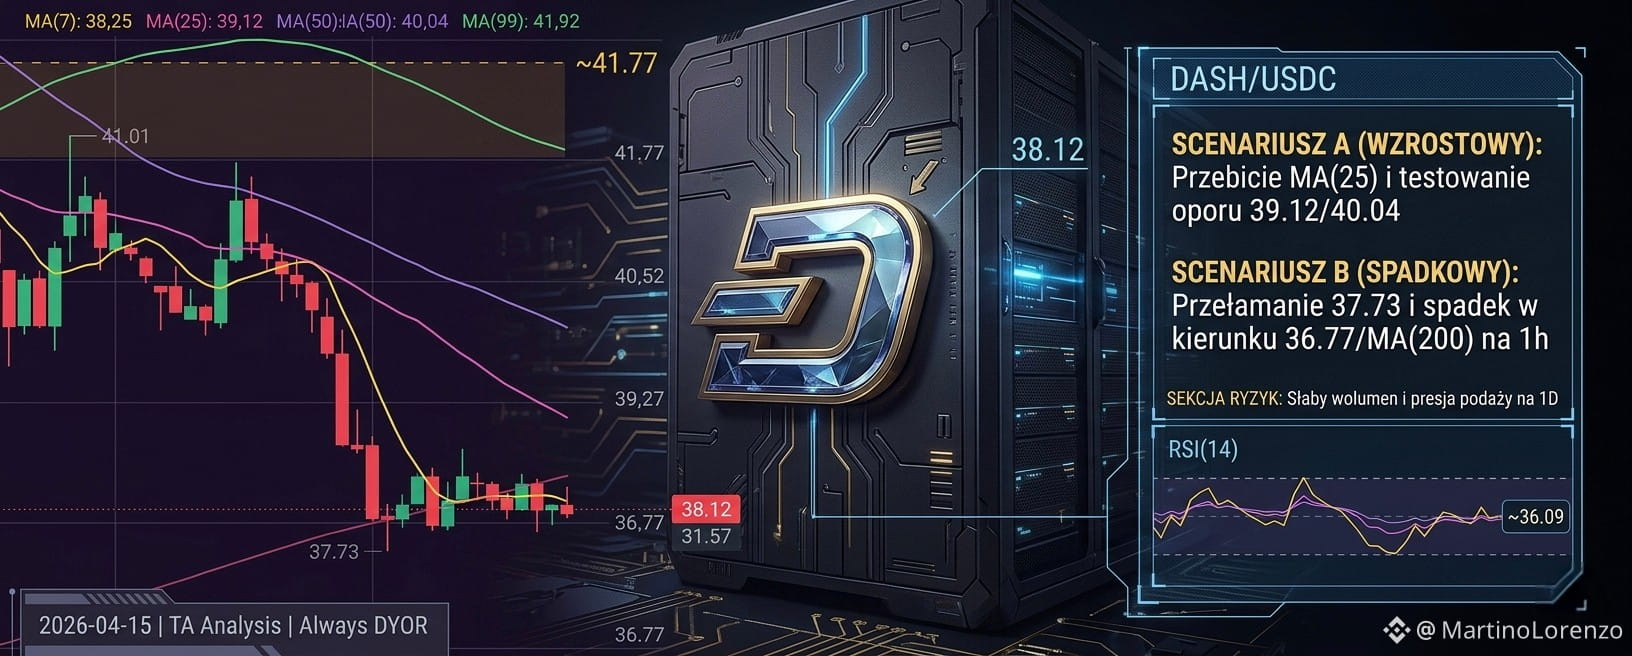
The analysis of the DASH/USDC pair based on the provided screenshots indicates a strong bearish sentiment. The DASH price is in a clear downtrend on the 1h timeframe, breaking through key moving averages (MA(7), MA(25), MA(50), MA(99), MA(200)). We are currently observing a test of the level 38.12, which represents a critical support zone. Supply is dominant, and demand appears weak.
Scenario A (Bullish): If demand successfully defends the support around 37.73/38.12 (where MA(200) is on 1h) and breaks the local resistance at MA(25) around 39.12/39.27 with increased volume, the path opens up to test further supply zones, including MA(99) on 1D (around 40.97). Breaking through resistances may intensify the upward movement.
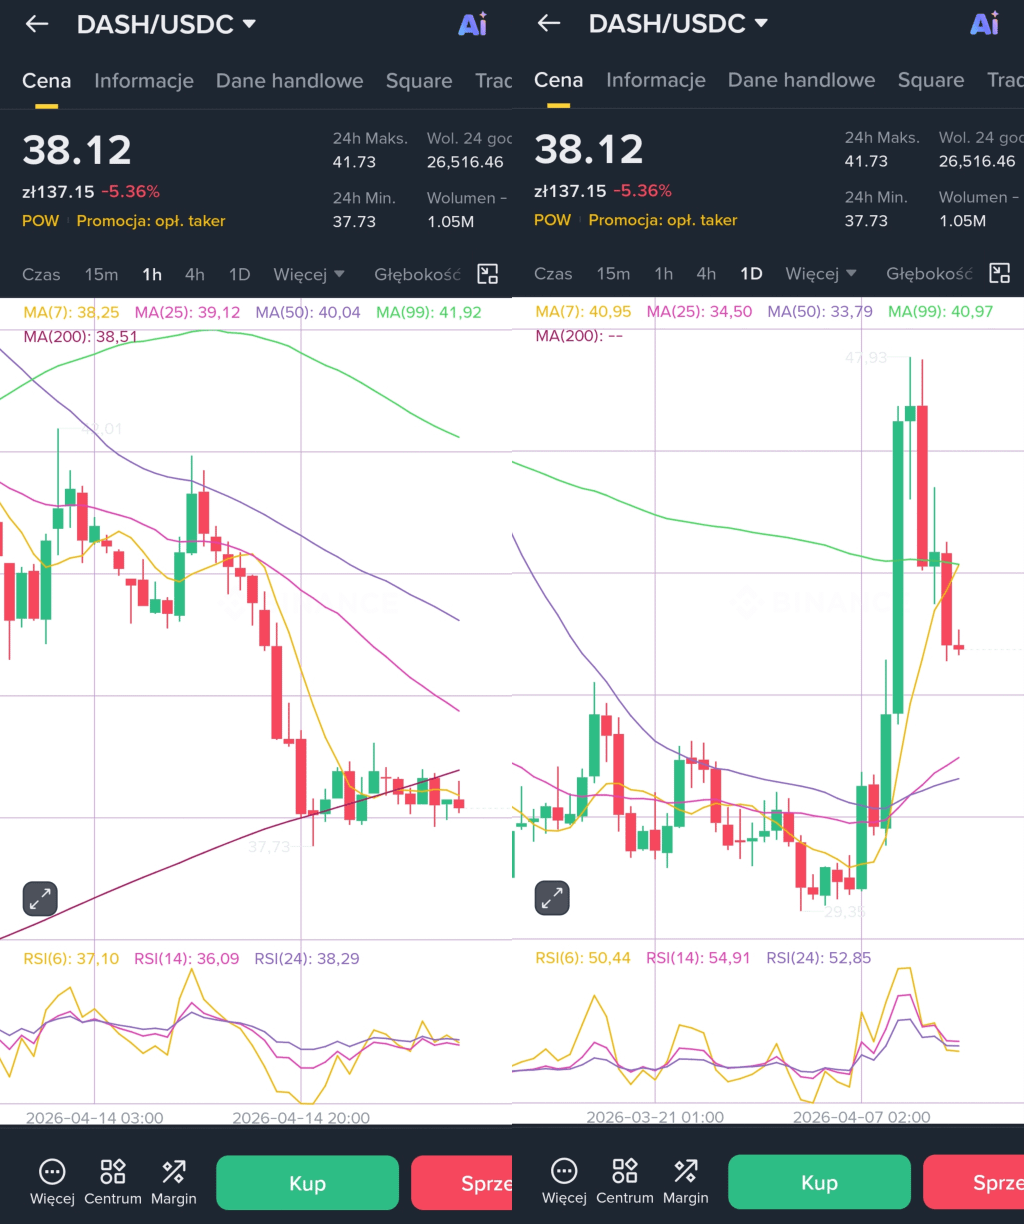
Scenario B (Downtrend): Failure to maintain the level of 38.12 or a drop below MA(200) on the 1h may indicate that supply is taking full control. Another key support level is the area of 36.77. Breaking this zone may deepen the correction towards MA(25) on the 1D (around 34.50).
Risk Section: It is necessary to monitor the volume during attempts to break resistances and the RSI, which on the 1h is in the undervaluation zone (RSI(14): 36.09), which may suggest a potential rebound, but without strong volume it will only be a correction. Additionally, the price dynamics on a higher timeframe (1D) suggest that the long-term downtrend has not yet been definitively reversed.
$DASH #DASH #DigitalCash #Binance #trading #dyor
You can find more details about this project on my profile.
2026-04-15 | Always DYOR & Research
This is not investment advice.