Ethereum market analysis and contract strategy suggestions on April 15, 2026
1. In-depth technical analysis
1. Weekly K-line chart (macroeconomic trend)
- Trend judgment: The weekly level is currently in a repair period after a significant oscillation and decline. The price is currently around 2338, at a relatively low level.
- Moving average system: The price is currently under pressure from long-term moving averages (MA20: 2472, MA30: 2891). The short-term moving averages MA5 (2135) and MA7 (2112) are forming support below.
- MACD indicator: MACD is below the zero axis, but DIF and DEA are starting to flatten out and show slight upward signs. The green bars are shortening, suggesting that the long-term downward momentum is weakening, indicating a demand for bottoming and rebound.
- Conclusion: The bearish trend in the larger cycle has not completely reversed, but the downside space is limited, and it is trying to build a bottom.
2. Daily K-line chart (medium-term trend)
- Trend judgment: After a significant drop at the daily level (from 3400 to 1736), it is currently rebounding within a wide fluctuation range.
- Key level: The price is around 2339. The moving average system is starting to entangle, with MA5, MA7, MA10, MA20 densely distributed in the range of 2150-2300.
- Support and resistance: Strong support below is around 2150 (near MA20), resistance above is in the range of 2400-2450.
- MACD indicator: Daily MACD golden cross upwards, red bars are increasing, indicating that the bullish momentum at the daily level is still present and in a rebound cycle.
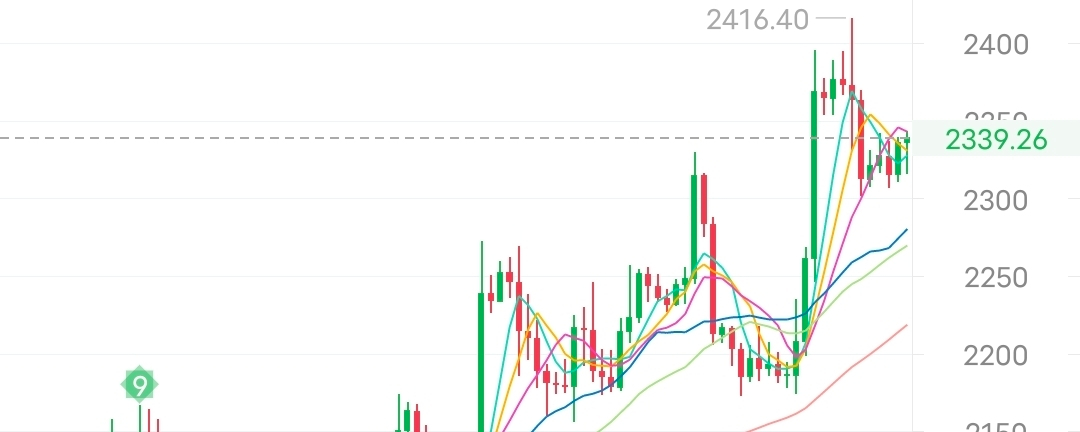
3. 4-hour K-line chart (short-term trend)
- Trend judgment: The 4-hour level shows a 'high pullback' trend. There was a strong surge to 2416, followed by resistance and a pullback.
- Pattern analysis: The price has currently broken through the previous rising trend line and is undergoing horizontal consolidation in the range of 2300-2350.
- Moving average system: Short-term moving averages (MA5, MA10) are turning down, slightly suppressing the price, but long-term moving averages (MA60: 2218) are still upward, providing support.
- MACD indicator: MACD death cross, green bars appear, indicating that short-term bearish forces dominate, with pullback pressure.
4. 1-hour K-line chart (ultra short-term/intraday)
- Trend judgment: The 1-hour level most intuitively reflects the current fluctuations. The price is fluctuating narrowly between 2330-2360.
- Key signal: The moving average system is very entangled (MA5-MA60 are all between 2300-2335), indicating that the market is in a hesitating period, direction is unclear.
- MACD indicator: MACD is consolidating near the zero axis, with DIF and DEA values very small, which is a typical precursor to a trend change.
II. Comprehensive market summary
Current status: pressure above, support below, the large cycle rebound is not complete, the small cycle is facing a pullback.
- Bullish logic: The rebound trend at the daily level is not broken, strong support below 2150-2200.
- Bearish logic: The 4-hour level faces resistance and falls back, with long-term moving averages on the weekly level suppressing it, lacking strong momentum to break 2400 in the short term.
III. Today's contract strategy recommendations
Based on the current price position of 2339, it is recommended to adopt a strategy of 'range fluctuation, short high and long low', focusing on short-term shorts and long-term longs.
Strategy A: Short-term short (bet on a pullback)
Due to the 4-hour level being in a pullback phase, and clear pressure above 2400.
- Opening position: 2360 - 2380 range (if the price rebounds to this point).
- Stop-loss level: 2410 (stop-loss if breaking the previous high).
- Take-profit level: First target 2320, second target 2300.
Strategy B: Buy low (trend rebound)
Daily MACD golden cross, the overall direction is still a rebound repair.
- Opening position: 2300 - 2315 range (pullback to moving average support).
- Stop-loss level: 2280 (below short-term support platform).
- Take-profit level: First target 2350, second target 2390.
Strategy C: Wait and see (waiting for a breakout)
If the price fluctuates in such a narrow range of 2330-2350 and trading volume shrinks, it is recommended to stay on the sidelines and wait for MACD to show a clear direction.
Risk control reminder
1. News: Pay attention to the opening situation of the US stock market tonight and whether there are any sudden news in the crypto market (such as ETF fund flows).
2. Leverage control: Fluctuating markets are prone to back-and-forth spikes, it is recommended that leverage does not exceed 5-10 times.
3. Core focus: Pay close attention to 2416 (previous high pressure) and $2300 (integer support). If these two positions are not broken, it will be a fluctuation; if broken, it will be a unilateral trend.