The Bitcoin chart that explains everything!
Those who say that there is no liquidity below 60 thousand are either lying or have no idea what they are talking about. The reality is that there is a lot of liquidity between 53-57k, and similarly, there is also quite a bit of liquidity between 76-85k. Market makers generally hunt liquidity on both sides, and this is what makes the current situation dangerous for most traders who do not understand the full picture.
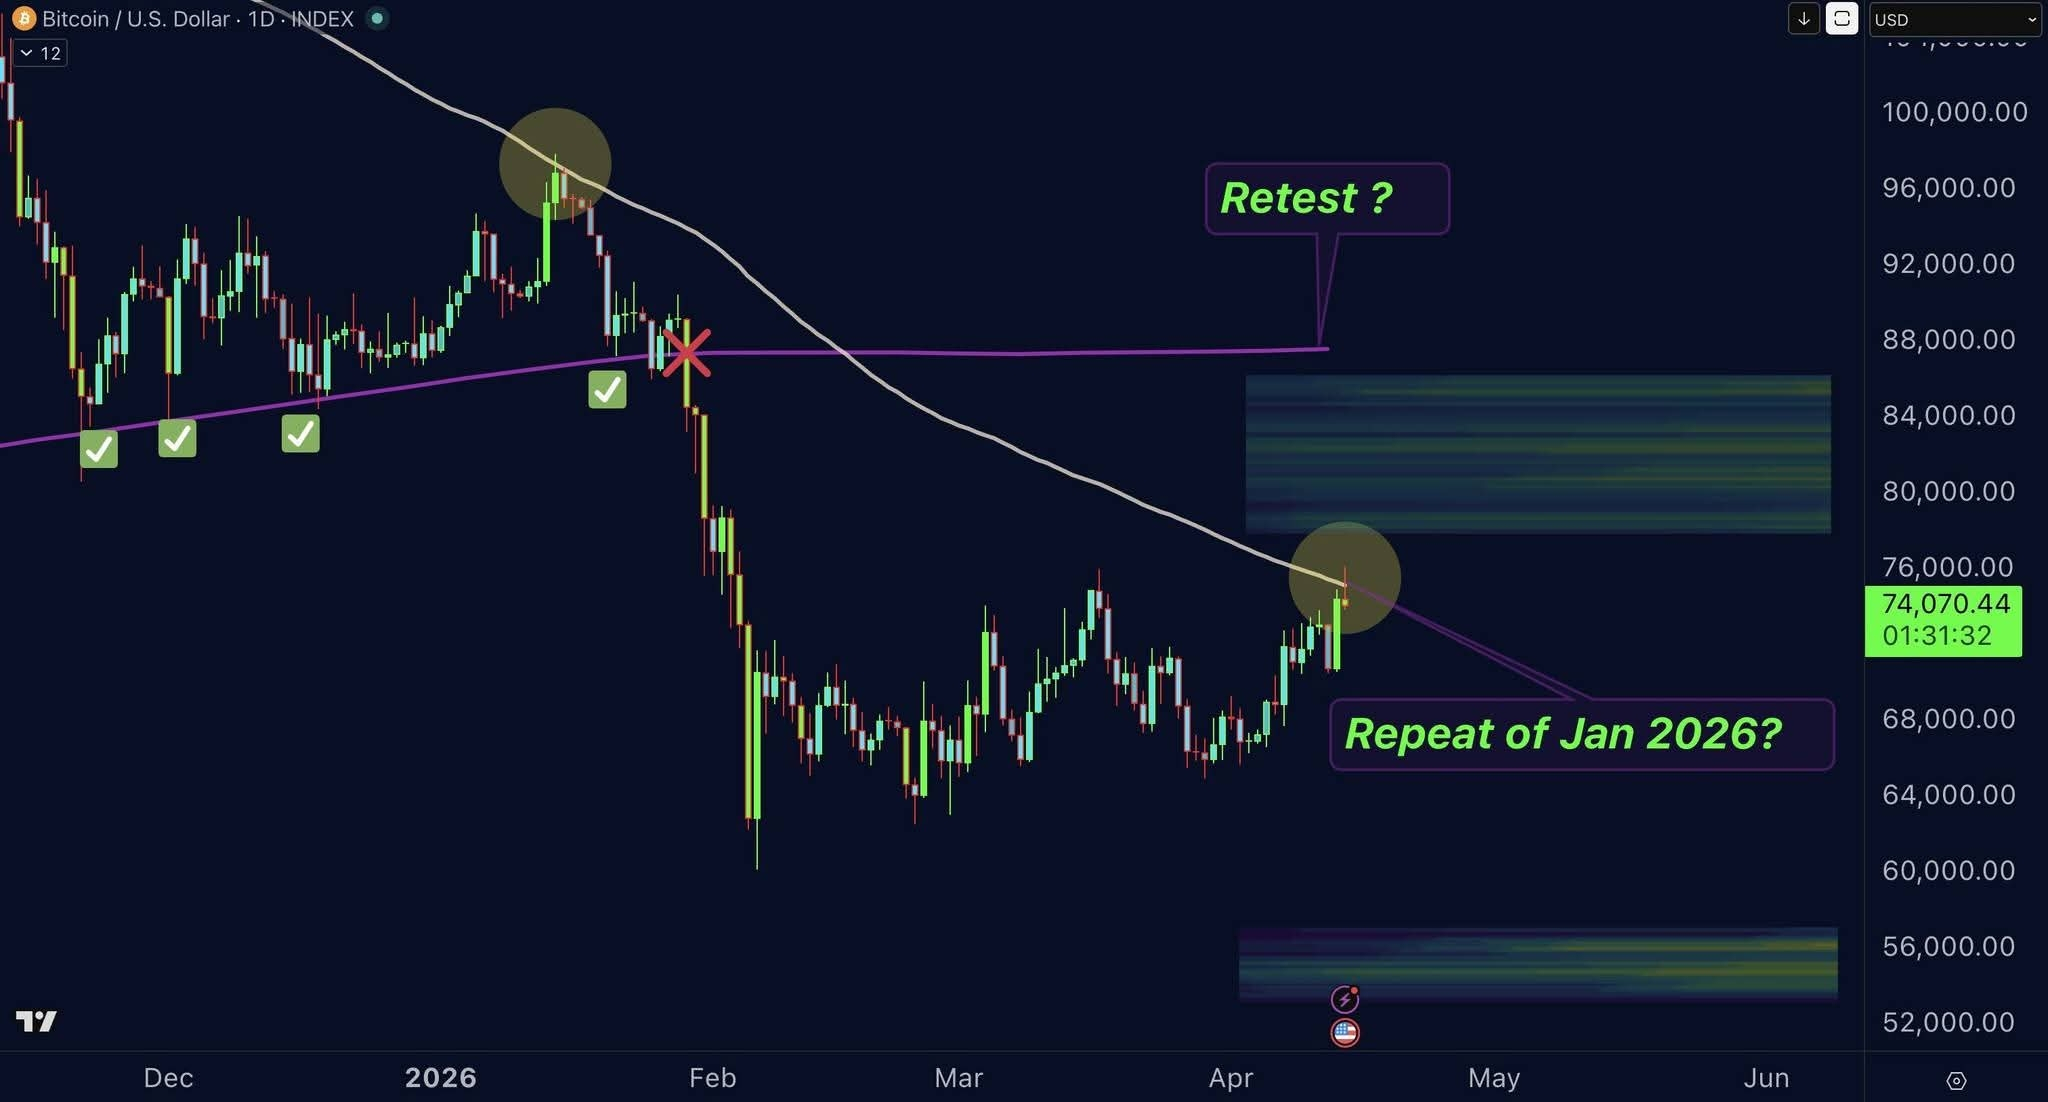
At this time Bitcoin is around 74k, and we have a strong resistance line (white line) that was rejected in January 2026, and after that, there was a significant drop in the market. Even today, Bitcoin touched that resistance and was rejected again.
Now the real question is: will market makers ignore the liquidity above?
I don't think so.
The market also has the potential to move from 79k to 84k.
In the meantime, it may also retest the break-off structure (purple line) that will occur in January 2026.
Now the question is how much the price will go up before the next major drop?
Will it reach the white line or the purple line?
The answer is hidden in the liquidity below.
I have been saying since January that the market will move sideways for a long time, and there is only one reason for that: to create more liquidity below.
There was almost no liquidity below 60k in January, so why do market makers bring the price down when there is nothing to take?
At the same time, market makers move the price sideways to create liquidity below.
If they don't find the liquidity below sufficient, they push the price up through futures longs to assure people that the bullish trend has returned.
This is the trap that is currently happening.
Overall, it is very important to understand that Bitcoin is still completely bearish.
We will look at the lower levels again.
At this moment we are in a bullish trap.
Only one question remains:
Where will this trap end?
At the white line?
Or near the purple line?
The answer cannot be given right now, but when we see how the price reacts at the white line, more clarity will emerge.
That's why I said that the sideways movement will last long.
Most people did not expect it to go until April, but I kept saying that it would take 3 to 4 months.


