Day 5:
Hello! Good Morning Brotherhood of the Binanciera Community!
After learning to use STOP-LOSS and technical indicators (RSI, EMAs, and Volume), it's time to get hands-on. Today we are going to analyze the cryptocurrency Solana $SOL , which (in the past) was showing clear signs of exhaustion and weakness against the market.

*What is happening with Solana?
$SOL was found under considerable selling pressure after 6 consecutive months of a downward trend. It has lost key support levels and network activity has drastically decreased.
*3 Signs of Weakness:
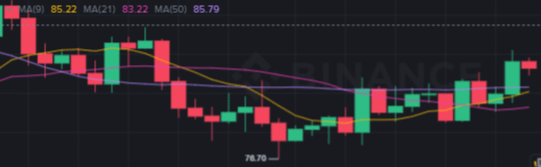
Resistance rejection: The price attempted to reclaim the $88 - $90 zone but was strongly rejected. In a bearish market, these bounces are opportunities for sellers to re-enter.
RSI in bearish territory: If you look at the 4-hour (4H) chart, you'll see that the RSI failed to surpass the $50 level. This confirms that buyers don't have the strength to reverse the trend.
Declining TVL and Activity: On-chain data shows that capital has been flowing out of the Solana ecosystem. Less money locked up (TVL) is often a precursor to lower prices.
*Strategy:
.- Entry Point (SHORT): You would look for short entries if the price tests the $85.50 resistance again and shows weakness.
.- Target (Profits): The next psychological support level is at $80.00, with a deeper technical stop near $74.00.
.- Stop-Loss (Protection): I would place it strictly above $91.20. If the price crosses that level, the bearish analysis is invalidated.
Do you see $SOL recovering or do you think $74 is inevitable?
Leave your comments.
#Solana #SOL #TechnicalAnalysis #Bearish #BinanceSquare #WriteToEarn #TradingStrategy
Legal Disclaimer: "This is not Financial Advice, it's an Educational and Didactic article. Trade at your own risk!"