Hormuz Opens, Oil Collapses 10%, and $BTC Finally Takes Out the Level That Stopped Everyone
Let me describe a scene that is unfolding as I write this.
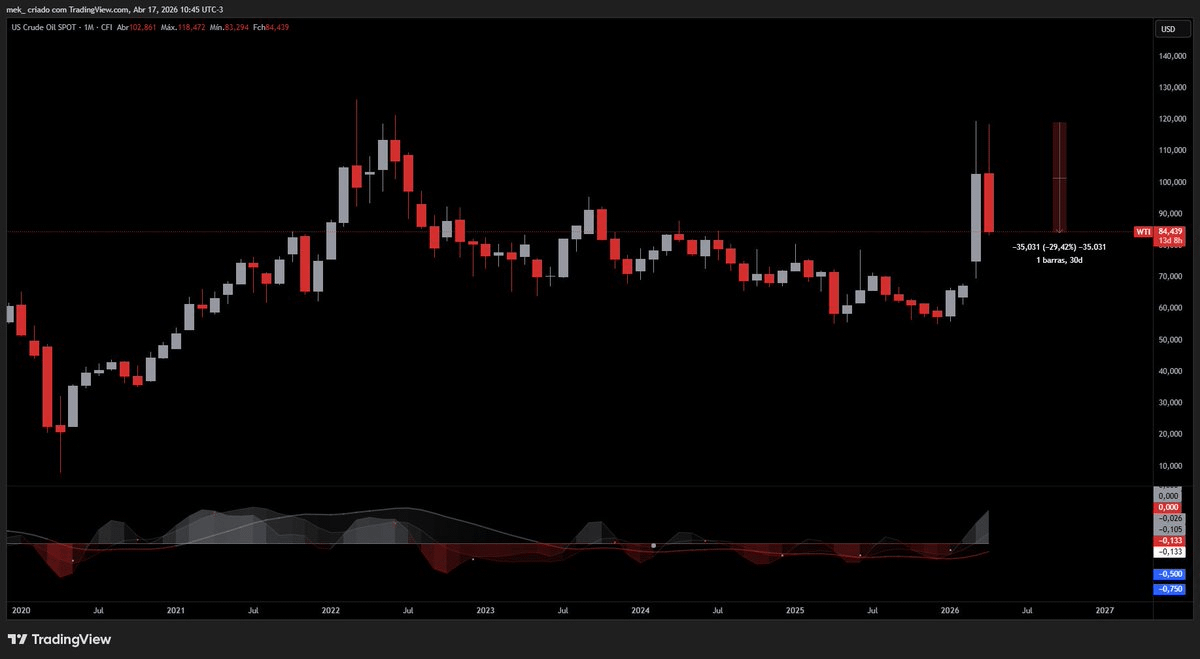
Three things just happened simultaneously. The first tankers are passing through the Strait of Hormuz under French-British escort for the first time in seven weeks. Brent crude has collapsed 10% in a single session, now trading at $84 after touching $99 on Thursday. And $BTC is at $77,000. $ETH sits at $2,400. The market that spent nine consecutive weeks absorbing geopolitical shocks just got permission to breathe.
I want to work through what this moment actually reveals, because I think almost everyone is about to read it incorrectly.
The easy narrative writes itself: oil down means inflation fears ease, which means rate cuts become possible again, which means risk-on, which means $BTC pumps. That story is true on the surface. It will dominate the feeds today.
But the structural story is different. And if I am reading it correctly, today is not the beginning of a rally. Today is the confirmation of a regime shift that happened three weeks ago and nobody noticed.
WHAT ACTUALLY HAPPENED THIS MORNING
The mechanics matter. France and the United Kingdom organised a defensive multilateral mission. Macron and Starmer announced coordination on April 14. The first non-Iranian tankers moved through the chokepoint under protection overnight. The CENTCOM blockade remains on Iranian-origin and Iranian-bound vessels only; the broader strait is functionally open.
Oil markets responded immediately. Brent dropped from $99 to $84, about 10%. West Texas Intermediate fell below $80. The 36% rally in crude that drove nine weeks of global risk repricing just reversed hard in a single session.
Here is what that does to the macro picture. The Dallas Fed’s working paper published two weeks ago projected that a one-quarter Hormuz closure would add 0.16 to 0.40 percentage points to Q4 headline PCE. A two-quarter closure: 0.42 to 0.79. A three-quarter closure: 0.85 to 1.47. Those projections assumed the closure was the central variable. Removing that variable partially reverses the inflation path.
The Fed meets on April 29. Two weeks ago, the dot plot signalled one cut in 2026 and zero conviction. If oil sustains at $84 or lower into that meeting, the conversation changes. Not dramatically. But enough.
WHY THE FLOOR HELD
Now the part that matters more than the headline.
In the last three weeks, $BTC absorbed an environment that should have broken it under the old market structure. Iran-US war escalated. Strait of Hormuz closed. Oil crossed $100. March CPI printed 3.3%, the hottest since May 2024. U.S. Producer Prices hit 4.0% YoY. Fed rate cut expectations collapsed. CME Bitcoin futures activity dropped to a 14-month low. The Fear and Greed Index held below 15 for sixty consecutive days.
By every framework that worked in 2021 or 2022, $BTC should be at $55K right now. Maybe lower.
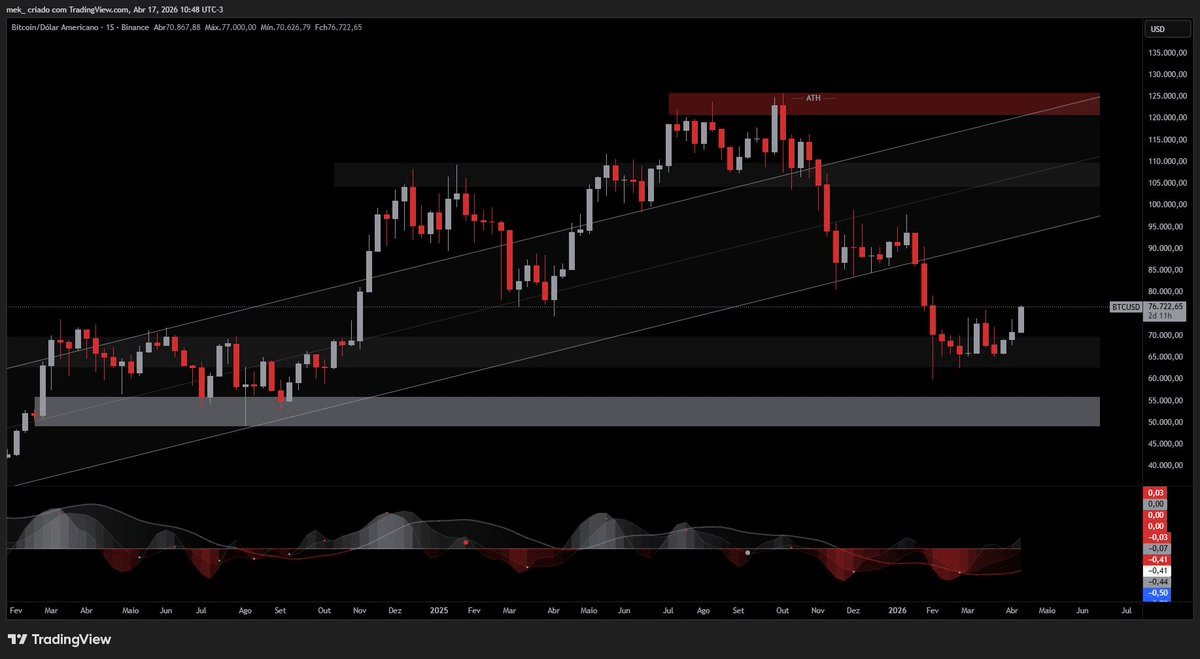
It held $70K as structural support. The lowest print during the entire nine-week crisis was $70,526 on April 13, hit once, for approximately one hour, immediately absorbed.
That is not sentiment. That is mechanics.
Let me show you the math that explains it, because once you see it, every other framework becomes obsolete.
Bitcoin miners produce 450 BTC per day post-halving. That is the new issuance.
In April so far:
• Strategy absorbed approximately 1,400 BTC per day via STRC-funded purchases. On April 13 alone, an estimated 7,800 BTC were bought in a single session, which is 17 times daily mining output.
• U.S. spot Bitcoin ETFs averaged roughly 1,200 BTC per day in net inflows. BlackRock’s IBIT alone added $612 million over five sessions in early April.
• Morgan Stanley’s MSBT launched on April 8 with 16,000 wealth advisors and $9.3 trillion in client assets behind it. Day one: $34 million in inflows. Week two: advisor network beginning to direct client capital.
• Charles Schwab activated spot Bitcoin trading this week. 35 million brokerage accounts now have one-click $BTC access.
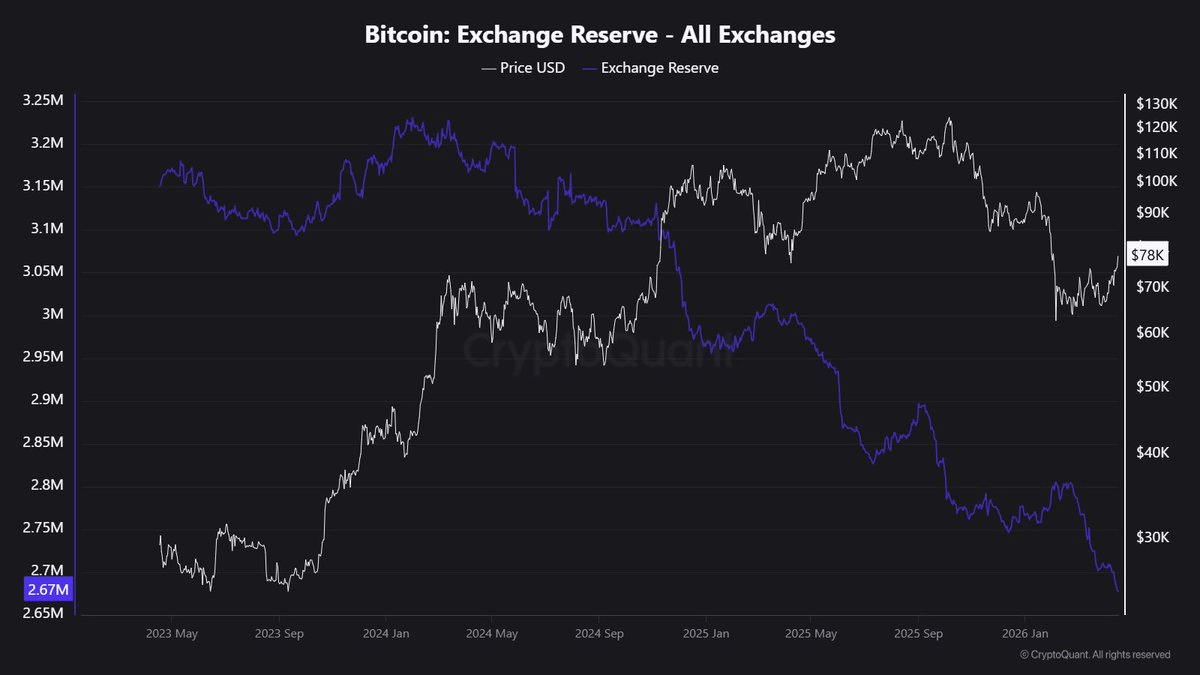
• Exchange reserves fell to 2.6 million BTC, the lowest since December 2017. Net outflows of 48,500 BTC over 30 days. Coins moving from liquid exchange inventory to cold storage, ETF custodians, and corporate treasuries.
The supply math: 450 BTC new per day against 2,600+ BTC structural daily demand from just Strategy and ETFs combined. That is a daily deficit exceeding 2,100 BTC. The difference comes from forced sellers. And those sellers are running out.
THE PARADOX OF EMPTY EXCHANGES
This is the contradiction I keep returning to because I think it is the most important signal nobody is tracking.
The Fear and Greed Index held “Extreme Fear” for sixty consecutive days. The longest sustained fear reading in $BTC’s post-ETF era. Meanwhile, the coins available to buy from fear sellers dropped to a seven-year low.
These two facts should not coexist.
If the market were genuinely capitulating, coins would flow onto exchanges for liquidation, not off them. Panic requires sellers. Sellers require exchanges. The opposite happened.
The resolution is simple once you see it. The fear was real. It was concentrated in retail, older whales, and miners. CoinDesk reported in early April that 30-day apparent demand was negative 63,000 BTC. Institutional buyers absorbed 94,000 BTC in the same period. The rest of the market sold 157,000 BTC. But the absorbed supply did not return to circulation. It moved to entities that do not sell on geopolitical shocks.
CryptoQuant CEO Ki Young Ju framed this precisely. When exchange whale ratios decline while net outflows accelerate, large holders are shifting from distribution to accumulation. That is exactly what the data showed for nine consecutive weeks.
The fear told you what the crowd felt. The reserves told you what the capital did. The market has never resolved that paradox in favour of the crowd.
THREE REJECTIONS, THEN THE BREAK
Earlier this week, $BTC rejected $75,000 three consecutive times. Monday, Wednesday, Thursday. Each attempt failed at roughly the same level. The crowd read this as resistance strengthening. I argued here on Wednesday that the opposite was happening: each test was absorbing sell-side liquidity, thinning the wall.
This morning, at $77,000, the wall broke.
Not because sentiment shifted. Because the liquidity that had been selling into $75K ran out. The Hormuz opening was the catalyst, not the cause. The cause was the structural compression built over the preceding nine weeks. Remove the geopolitical overhang, and the imbalance that was already there resolves quickly.
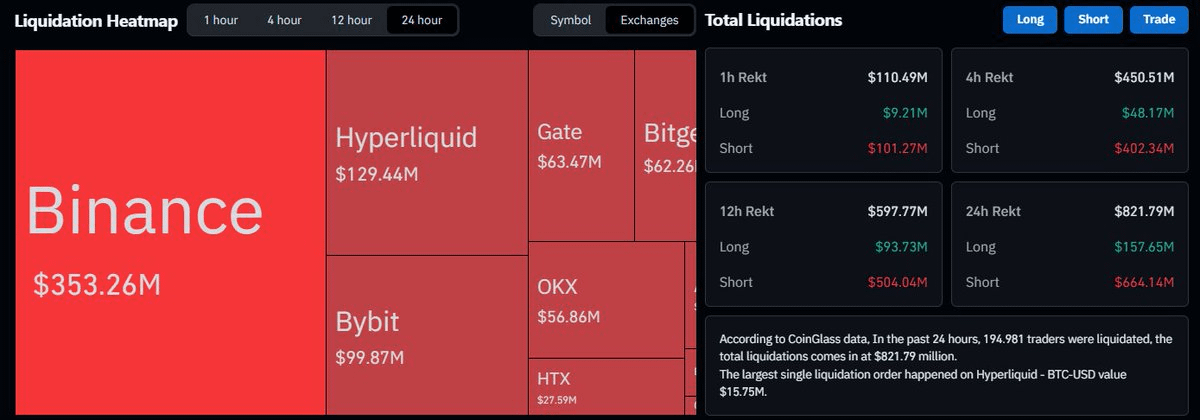
Above $77,000, approximately $200 million in short positions sit stacked between here and $80,000. CoinGlass liquidation heatmaps show concentrated liquidity at $78,200, $79,400, and the psychological level at $80,000. Those shorts become fuel.
WHERE THE MARKET ACTUALLY IS
Let me be direct about what I think the map looks like right now.
$ETH rallied from $2,100 to $2,400 this morning, up 7%. On-chain transactions jumped 41% over the past week. ETH/BTC ratio climbed to 0.0313, the highest in three months. That is not Bitcoin-only momentum. That is capital rotating into risk.
$SOL trades at $87, up 6%. Weekly crypto fund inflows hit $1.1 billion last week, the strongest since January. That flow is continuing this week based on preliminary data.
Strategy has $21.6 billion in remaining STRC issuance capacity. At current deployment pace, that represents 300,000+ BTC of potential structural demand. Fundstrat warned this week of a “demand air pocket” if Strategy pauses buying. The warning assumes Strategy would pause. At 11.5% yield and $1.16 billion in single-day STRC volume, there is no scenario where the machine pauses in this environment.
The two-week U.S.-Iran ceasefire expires on Tuesday, April 21. If it extends, oil stays suppressed and the rally continues. If it breaks, oil spikes and $BTC likely retests $72-73K, which would now function as support rather than resistance.
Either way, the floor sits higher than it did two weeks ago. The holders who bought $70K did not sell at $75K. The holders at $75K are unlikely to sell at $77K. Each level tests a higher cohort of structural conviction.
THE CALL FOR THE NEXT 14 DAYS
I rarely publish explicit price calls because I prefer frameworks to predictions. But the setup is unusually clean, so here is how I am reading it:
Base case (60% probability): $BTC holds above $75K through the April 29 FOMC. Short liquidations between $77K and $80K fuel the move. Target: $82-85K by mid-May. Driver: combination of rate cut hope reemergence, ceasefire extension, and structural bid acceleration.
Bull case (25% probability): Ceasefire converts to a formal deal before April 21. Oil drops below $80. The Fed signals a June cut is back on the table. $BTC takes $80K decisively and targets $90K. This scenario requires fast resolution of the Iran variable.
Bear case (15% probability): Ceasefire collapses Tuesday, Hormuz reclose, oil spikes back to $100+. $BTC retests $72-73K. Critically, this does not break the structural thesis. The same institutional mechanisms operate at lower prices, and forced sellers continue to be absorbed. A bear case retest is a buying opportunity, not a regime change.
The symmetry matters. The upside asymmetry is significant because the sell wall above is thin. The downside is bounded because the bid below is structural.
Nine weeks of war. Oil above $100. Inflation re-accelerating. Rate cuts disappearing from the forecast. Sixty days of Extreme Fear.
And $BTC held.
Not because the crowd believed. The crowd did not. Not because the charts said so. The charts said sell. It held because the infrastructure built over the past 18 months does not check sentiment indicators.
This morning, Hormuz opened. Oil collapsed. The wall at $75K broke. But the break was the symptom, not the diagnosis.
The diagnosis is this: you are not watching a rally. You are watching the confirmation of a market regime that has already changed.
The only question left is whether you see it now, or whether you see it in hindsight at $90K.
- Mek