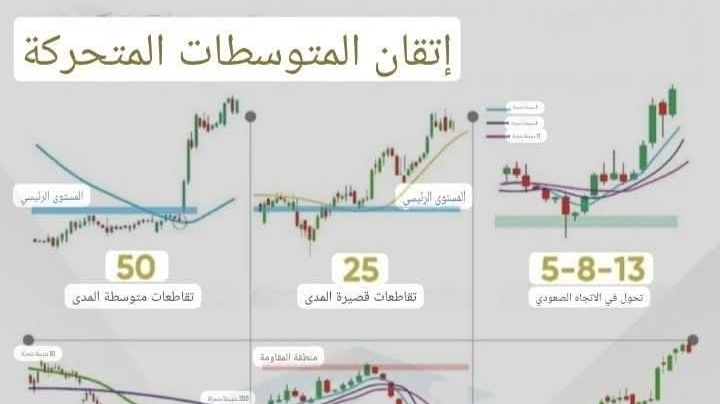
This image combines the most important uses of moving averages in trend reading, identifying entry and exit points, and recognizing strong trend shifts:
50 MA – Medium-term crossovers
When the price breaks the 50 MA line, momentum changes and a new trend often begins.
25 MA – Short-term crossovers
A sensitive indicator showing rapid direction changes and immediate entry opportunities.
5–8–13 MA – Bullish Trend Shift
The alignment of short averages in this order gives an early signal of the beginning of a strong bullish trend.
50–200 MA – Death Cross
The drop of the 50 MA below the 200 MA means the market is entering an extended bearish trend.
5–8–13 MA – Bearish Trend Shift
The exact opposite of the bullish pattern and indicates an early reversal of direction downwards.
100 MA – Medium/Long Range Retracement
Price retracement from the 100 MA is used as buying areas in bullish markets.
8–15 MA – Short-term Entry
Ideal fast crosses for scalping and instant trading.
200 MA – Long-term Direction Retracement
The price's respect for the 200 MA determines whether the overall trend is still bullish.
50–200 MA – Golden Cross
The rise of the 50 MA above the 200 MA is considered one of the strongest signals for long-term bullish trends.
Summary:
Averages are not just lines… but a clear language for direction, momentum, and reversals. Each average has its role: short for quick entries, medium for clearer trends, and long for determining the full picture of the market. Using these models together provides the strongest possible trading signals.
#Forex #Forex_for_Beginners
#Forex #Trading #Technical_Analysis #ema #سكالبينج #Learn_Trading #Forex #Trading #priceaction #استثمار $ETH