When you read this article, the market may be immersed in a seemingly strong rebound: sentiment indicators are warming up, KOLs are collectively shouting “the halving bull is late but won’t be absent,” countless retail investors rush into the market to buy the dip, fearing they will miss the next round of a hundred thousand dollar bull market.
But as a trader who believes in underlying logic and on-chain real data, I must pour a bucket of extremely cold water on you: all the rebounds you see are slaughter traps tailor-made for you by the main force; the halving bull you expect is merely a fantasy of your wishful thinking; the bear market is far from over, and the real ultimate crash is just about to begin!
In the past half month, I have tracked every micro-movement from LTH pain index, MVRV cross-cycle mirror divergence, to the inversion of active chip costs through dozens of on-chain data deductions. Today, I have completely stitched all data clues together and written this article. It is long, extremely brain-burning, and even full of bloody flavors, but if you can read it patiently, it will be your only moat for surviving in this epic bear market.
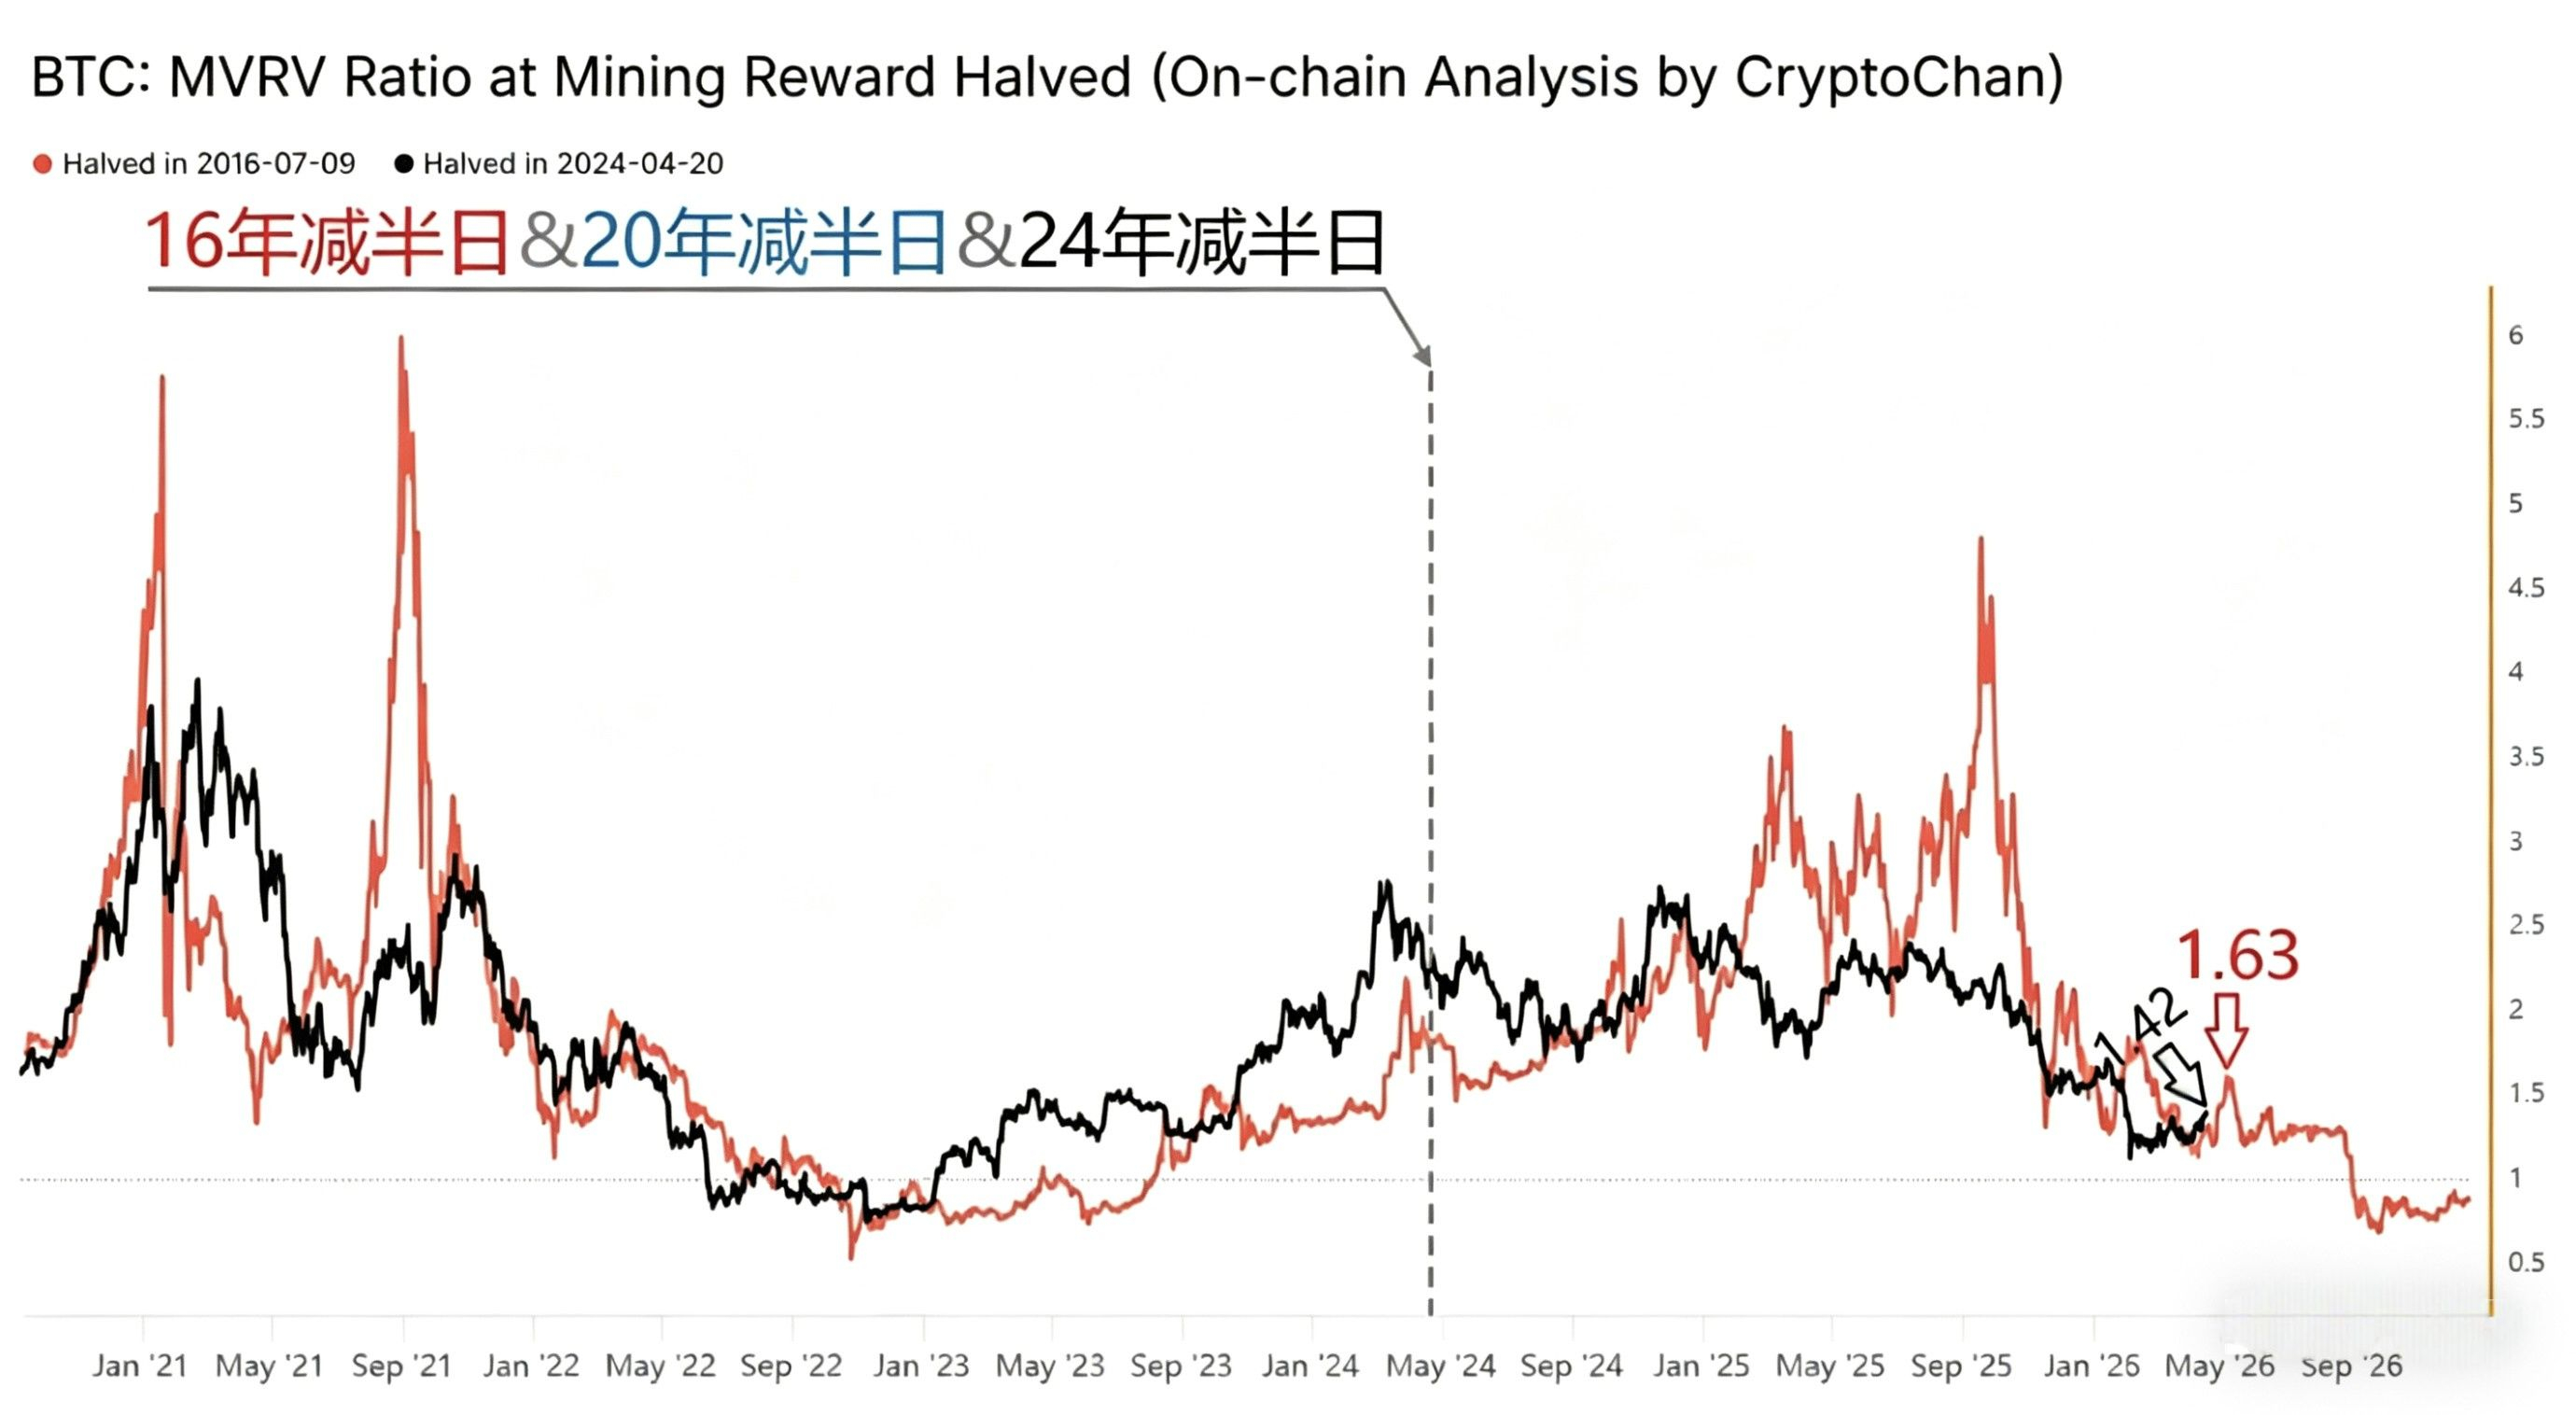
🚨 The first illusion is shattered: the MVRV mirror evidence shows that 1.42 is the death ceiling for this round of rebound.
Everyone shouting 'the bull market is back' dares not show you this chart—this BTC MVRV trend mirror chart spans two halving cycles and lays bare the market’s bottom cards.
The red line represents the complete trend of MVRV (circulating market value/realized market value, a core macro indicator measuring the overall profit and loss state of the market) after BTC's second halving in July 2016; the black line represents the real-time MVRV trend since BTC's fourth halving in April 2024.
No complex technical analysis needed; the visible mirror overlap has already written the market script: the halving bull and bear cycle from 2016-2018 is being perfectly replicated in 2024-2026, the only difference being that the momentum of this round's rebound is weaker by more than one order of magnitude than the last.
Looking back at the 2018 bear market, after experiencing a collapse at the beginning of the year, the market oscillated around the $6,000 line, leading to a strong rebound that made the entire market shout, 'The bear market is over, the bull market has restarted.' At that time, MVRV peaked at 1.63—this was the last escape window for retail investors during the bear market.
And what was the result? After this wave of rebound comes the ultimate sell-off that completely destroys faith: BTC directly halved from around $6,000, plunging to a low of $3,155, burying all retail investors who bottom-fished during the rebound halfway up the mountain.
Looking at today's market: the recent 'return of the bull market' rebound, with MVRV peaking at only 1.42, has already shown extreme fatigue, and it hasn't even reached the height of that dead cat bounce in 2018!
What does this mean?
The essence of MVRV is the average profit and loss ratio of all market holders: a value above 1 indicates the market is generally in profit; the higher the value, the more profit positions there are, leading to greater selling pressure. A value of 1.42 means the average profit of all market holders is only 42%, and it can no longer rise—main forces have no intention to lift retail investors, but are instead using this mildly painful rebound to distribute their chips while attracting those afraid of missing out who shout that 'the halving bull will not be absent' to buy in at the highs.
More cruelly, above the current position lies the massive amount of trapped positions accumulated over the past six months: in the range from $60,000 to $70,000, more than 1 million BTC of trapped chips have settled, and every rebound is an escape window for trapped positions, creating immense selling pressure.
What you think is a reversal is just the last pie the main force draws for you before the abyss.
⏳ The second heavy time iron lock: dual indicator resonance; June-July 2026 is the ultimate time bottom for this round of bear market.
If the rebound is fake, the two most important questions for retail investors are: when will the true bottom come? How much longer do we have to endure?
The two 'death time locks' of on-chain data have given an indisputable answer: the true, unnew low for this round of bear market will be precisely set between mid-June and early July 2026.
The first time lock is the death cross of STH (short-term holders, holding time less than 6 months) cost line and the overall market realized price.
The realized price across the market is the average cost calculated based on the last on-chain transfer price of all circulating BTC, representing the most accurate bull-bear dividing line in the market; while the STH cost line represents the average holding cost of 'new money' that entered in the last six months.
The historical iron rule has never failed: the ultimate bottom of every bear market must be accompanied by the complete breach of the STH cost line below the overall market realized price—this means that all new money entering in the last 6 months is completely trapped, and the market has completely lost incremental funds, entering extreme stock game, with retail investors falling into collective despair and starting to cut losses without regard for cost.
As of April 2026, the realized price for BTC across the market is approximately $46,000, while the STH cost line is around $52,000, with a difference of less than $6,000. In the current weak oscillation around $60,000, the death cross that determines the last drop of the bear market will occur within a week at the earliest, and three weeks at the latest.
The second time lock is the countdown to zero for the ratio of STH cost to cross-cycle active chip cost.
Currently, the ratio of STH cost to <10-year active average price has dropped to 1.27. Reviewing the historical data from the last three rounds of bear markets, this indicator fell from 1.27 to 1.0—which is the core sign of a complete bottoming, meaning that the costs of short-term holders and the bottom costs of long-term active players are completely equal, leaving no structural profit in the market—the required time cycle stabilizes at 67-88 days.
Calculating from April 19, 2026, 67 days later is June 25, 2026; 88 days later is July 16, 2026. The two time locks perfectly resonate, locking the ultimate time bottom of this round of bear market firmly between mid-June and early July 2026.
What does this mean?
This means that even if you are extremely lucky and catch the lowest point in the upcoming crash, you must be prepared to endure a period of horizontal oscillation, dead water, or even a secondary bottom for 1-2 months. This is definitely not the V-shaped reversal you expect; it is an L-shaped marathon that wears down all retail investor faith.
🩸 The third price extreme: the bloody pin at the $30,000 mark is coming soon.
Since the time bottom has been locked, the second concern for retail investors is: where will this last drop fall? What will the lowest point be?
My multidimensional calculation result is: within the next 10-64 days, the market will have a 65% probability of creating a shocking bloody lower shadow line in the range of $29,800-$37,600; where $34,250-$36,270 is the core target range for this round of sell-off.
The origin of this interval is by no means a baseless mystical prediction but is based on mathematical deductions from cross-cycle on-chain data. Every point has solid historical data support.
The core deduction logic comes from the final psychological defense line breach calculation of long-term holders (LTH, holding time greater than 6 months):
1. The extreme threshold of LTH floating loss ratio.
Reviewing the ultimate bottoms of the last three rounds of bear markets, there is an iron rule that has never been broken: when a bear market bottoms, the floating loss ratio of long-term holders must reach a historical extreme of **27%-28%**.
In the 2018 bear market bottom, the floating loss ratio for LTH peaked at 28.1%; in the 2022 bear market bottom, this figure peaked at 27.6%. Currently, the floating loss ratio for LTH is only at 26.9%, just missing this deadly 0.5%!
This 0.5% gap is the space that the main force must smash out—only by pulling the floating loss of LTH to a historical extreme can the most determined 'diamond hands' completely despair, giving up their bloody chips, enabling the main force to complete the final accumulation.
2. The breach range of LTH cost defense line.
Currently, the true holding cost line for LTH is around $40,300. Historical data shows that in every bear market's last drop, the main force will inevitably smash the price through the LTH cost line by 10%-15% to completely break the psychological defense line of long-term holders.
Simple calculation: a drop of 10% from $40,300 is $36,270; a drop of 15% is $34,255. This is the core target range for this round of sell-off, precisely falling between $34,250 and $36,270.
3. Resonance verification of cross-cycle retracement ratios.
We will use the retracement ratio of the bull-bear cycle for secondary verification:
The maximum retracement from the top to the bottom of every bear market in BTC history has been: 94% in 2011, 86% in 2014, 84% in 2018, and 78% in 2022. It is clear that as the market capitalization of BTC increases, the maximum retracement during bear markets is gradually narrowing.
The historical top of this bull market was the $73,777 reached in March 2025. Calculating with a conservative 50% retracement, the bottom is $36,888; with a neutral 55% retracement, the bottom is $33,199. This result perfectly overlaps with the core range we calculated using the LTH cost line!
As for many people's concerns, will it break below $30,000 to fill the CME gap of over $20,000?
My conclusion is: there is a probability, but it is extremely low, only about 15%.
Because the 21-day crash from $70,000 to $50,000 has already liquidated the vast majority of high-leverage positions in the market, and the leverage in the market has dropped to its lowest level since the bear market bottom in 2022. Unless paired with extreme external macro black swans—such as stock market circuit breakers, violent rate hikes by the Federal Reserve, or full-scale escalation of geopolitical wars—otherwise, relying solely on the endogenous selling pressure of the cryptocurrency market, it is difficult for the price to stabilize below $30,000 for long.
But please remember: this ultimate bottom exploration will absolutely not be a gentle horizontal accumulation opportunity that lets you buy in slowly.
It will, like lightning, instantly smash through all support levels during a liquidity vacuum at some dawn, blowing up all long positions that bottom-fished, and then within seconds, be pulled up instantly by high-frequency trading robots and pre-placed orders from institutions. For retail investors, manually monitoring and bottom-fishing is a guaranteed death; only by preparing in advance can you capture this bloody lower shadow line.
☠️ The fourth ultimate signal: cost inversion, even diamond hands are bleeding at the end of the bear market.
Finally, I want to show you the most terrifying and ultimate signal that confirms the 'deep value zone' of this round of bear market: the market <=10-year active average price has officially fallen below the cost line of long-term players from 6 months to 7 years.
This is an extremely rare signal that has only appeared three times in BTC's 15-year history: the bottom of the 2015 bear market, the bottom of the 2018 bear market, and the bottom of the 2022 bear market. Each occurrence means the bear market has entered the final stage of bottoming, with only one step away from the ultimate bottom.
In a normal market environment, the overall market active average price is always higher than the cross-cycle old players' bottom cost—because old players are all positioned at low levels, with holding costs far below the market average.
But now, this indicator has completely inverted!
This means that the panic sell-off in the past few months has been so intense that it has forcibly pulled the average price of the active market down below the average bottom cost of the old players who entered the last cycle. Even those holding coins for 1-7 years, who have experienced complete bull and bear cycles and planned to hold on, have found their overall positions in a relatively underwater state!
This is the highest realm of the main force washing the market: not only killing off short-term high-leverage positions but also completely destroying the faith of long-term believers, making even the most steadfast doubt their faith amidst endless declines and repeated harvests of rebounds, ultimately giving up the chips in their hands.
But I want you to think in reverse when everyone is fearful: at this moment, the overall market average price of BTC is already cheaper than the bottom cost of the old players in the last cycle. Isn't this a once-in-a-lifetime left-side hitting zone?
Everyone says, 'When others are fearful, I am greedy,' but only less than 1% of people can truly align their actions with their thoughts when real fear arrives.
🛡️ Ultimate survival tactics: give up fantasies and start the bear market matrix defense.
Considering all the on-chain evidence above, the market script before us has formed a perfect closed loop:
1. Currently (late April to early May): the dead cat bounce inducing long positions is coming to an end, with MVRV peaking near 1.42, testing the pressure of the STH cost line, and the bullish momentum is gradually weakening;
2. In the next 1-2 months (May to early June): after the rebound encounters resistance and the bulls scatter, a stampede-style drop will occur, hitting a bottom pin of $34,000-$37,000, completely liquidating the remaining leverage, forcing the floating loss ratio of LTH to reach the historical extreme of 27%-28%;
3. In the next 2-3 months (mid-June to early July): the market will see the ultimate time bottom in extreme panic, followed by a long L-shaped horizontal bottoming period, solidifying the cycle bottom of 2026 in despair, to prepare for the next round of halving bull market.
As an ordinary retail investor, the only thing you should do in this bloody cycle is to give up all unrealistic fantasies and strictly follow these four survival rules:
1. Liquidate all short-term speculative positions, use rebounds to reduce costs or hedge.
Immediately stop all short-term contract trading and give up the fantasy of 'grabbing rebounds to make quick money.' For spot positions, use each wave of rebound to gradually reduce positions or lock in holding risks through compliant hedging tools; do not let yourself fall into a passive underwater situation in the upcoming sell-off.
2. Completely stop the suicidal operation of manually monitoring and bottom-fishing.
I emphasize again: the ultimate bottom pin is something that retail investors can never catch by manually monitoring. What you think is 'buying the dip' will only lead you to keep averaging down halfway up the mountain, getting trapped continuously until the real bottom arrives, leaving you with no bullets.
3. Start the [Black Swan Extreme Pin Capture Matrix].
Divide the funds you have reserved for bottom-fishing into 5-8 parts, spread them between $34,000 and $42,000, and use a pyramid-style order method with sufficient grid spacing: the lower the price, the larger the order amount. Do not engage unless the price hits the target; once it does, let the program automatically latch onto these bloody chips.
4. Be mentally prepared for a protracted battle, give up the fantasy of getting rich quickly.
If you successfully catch chips at the bottom, please immediately uninstall the market software and do not expect a rally next month. The BTC cycle has always been four years long; your goal is to survive until Q3 2026 to get the ticket for the next bull market.
Finally, I want to say to you:
Cycles never lie; they simply excel at amplifying human greed with extreme rises and amplifying human fear with extreme drops. They will use one round of rebounds and declines to filter out 99% of the unsteady souls, leaving the ultimate wealth only to those who respect the rules, fear the market, and can maintain rationality in despair.
When the abyss stares back at you, I hope this article can become the torch in your hand.
Follow me for continuous analysis of top on-chain data and tracking macro cycle turning points. True hunters always pull the trigger when their prey is most desperate.
Risk warning: All content in this article is personal opinion and does not constitute any investment advice. The cryptocurrency market carries extremely high investment risks; please make decisions cautiously based on your own risk tolerance. $BTC $ETH #比特币价格走势 #比特币周期分析 #比特币
