@Binance Vietnam Binance https://www.binance.com/vi/square/profile/binance_vietnam, tag $XAU , #BinanceAIPro
The price of Ethereum $ETH is trading around 2,108 USD on the 12-hour chart on 07/04/2024, down about 1% in the past 24 hours. This price level is generally unremarkable. However, four different technical indicators, derivatives, and on-chain data are all providing a common forecast, and all are not pointing downwards.
The last time this pattern appeared, at least from a technical standpoint, Ethereum's price surged by 16%. Whether history repeats itself will depend on several price zones currently quite close to the current price.
Two technical signals are converging on the 12-hour chart.
The first indicator is the Exponential Moving Average (EMA) structure, emphasizing recent price action more significantly.
On the 12-hour chart, the 20-period EMA at 2,083 USD is nearing the 50-period EMA at 2,086 USD. When the fast EMA crosses above the slow EMA, this is called a 'bullish crossover', typically signaling a positive shift in short-term momentum.#CreatorpadVN
This pattern started forming in mid-March 2024. When the crossover occurred, Ethereum's price rose by as much as 15.63%, breaking above the 100-period EMA. A similar phenomenon is currently repeating.
A similar phenomenon is repeating. Since 05/04/2024, the price has increased by another 7.59%, and the two EMAs are only 3 USD apart. The 100-period EMA is currently at 2,144 USD; if the crossover is confirmed, this will be the next area to watch.
Ethereum/USD rate on Kraken 12 hours: 02,107.22 H2.119.54 L2.094.10 C2.108.07 +0.83 (+0.04%)
EMA 20/50/100/200: 2,083.05 2,086.50 2,144.53
The second indicator is the Relative Strength Index (RSI) – a momentum indicator. From 19/03 to 06/04/2024, ETH made lower lows on the 12-hour chart, while the RSI made higher lows.
This represents a standard positive divergence, indicating that selling pressure is weakening even as the price tests lower levels. This divergence remains valid as long as ETH holds above the 2,086 USD level. If this threshold breaks, the overall structure remains, but the nearest drop won't be confirmed as a bottom until the pattern re-establishes.
When combined, the EMA convergence and RSI divergence create the technical groundwork for a potential bounce.
However, technical patterns alone are not enough to drive prices. Derivatives and on-chain data will reveal whether there is enough 'fuel' for a recovery.
significant increase in shorts and whales not dumping
The third indicator comes from the derivatives market. On 04/04/2024, Ethereum's total open interest reached 10.49 billion USD, with a funding rate around -0.0015%. By 07/04/2024, open interest increased to 10.77 billion USD, while the funding rate dipped further, down to -0.007%.
When open interest rises and the funding rate becomes increasingly negative, it indicates that the number of new short positions is growing. The accumulation of these shorts will act as a 'time bomb': If the price shoots up, shorts will have to buy back to cut losses, creating a 'short squeeze' that sends prices skyrocketing.
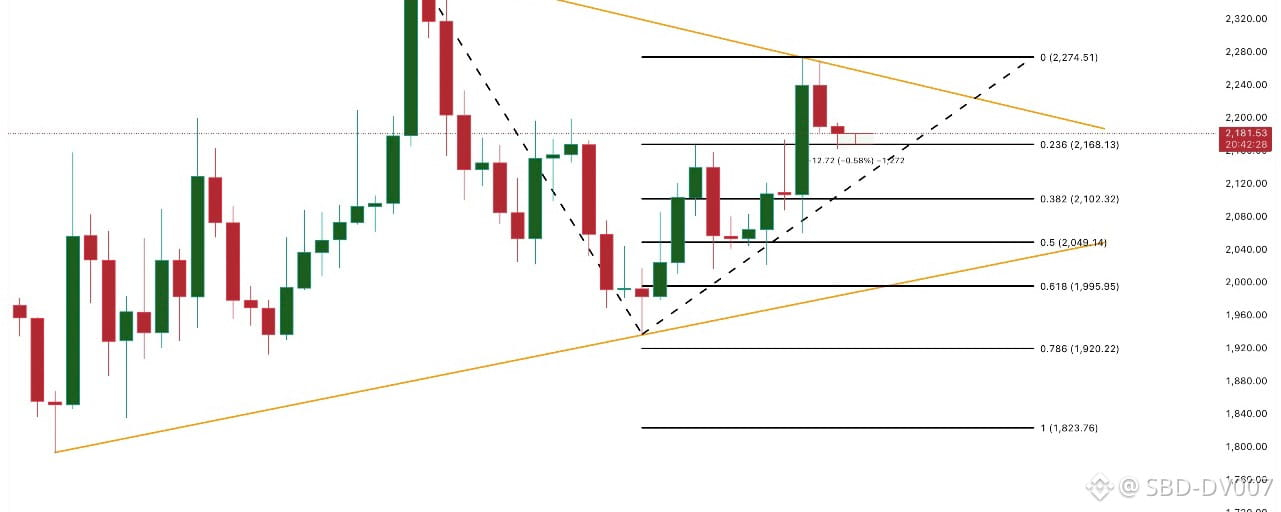
On the 12-hour chart, with the complete technical levels of the most recent swing, we will identify all key price zones.
The first resistance level Ethereum needs to break through is 2,116 USD at the 0.382 zone. If Ethereum closes above this level on the 12-hour chart, it will return to the area where a potential EMA crossover is likely to be confirmed, further boosting bullish momentum. After that, the most crucial resistance is 2,172 USD. This price level has repeatedly rejected Ethereum's rallies since mid-March 2024. A clear break above this level would signify the first positive shift in the short-term structure.
For this recovery to be truly strong, Ethereum needs to pump up to 2,228 USD at the 0.618 level, equating to a 5.77% increase from the current price. If the price closes above 2,228 USD, it will confirm that four indicators have pointed to a real trend change rather than just another failed bounce.
On the flip side, the 2,086 USD level is crucial for maintaining the RSI divergence. If it drops below this level, the 2,047 USD area at the 0.236 level will become temporary support. A break below 2,047 USD poses a risk of dropping to 1,935 USD, indicating that the four confluence indicators are insufficient to counter stronger bearish pressure in the market.
If the price closes above 2,172 USD on the 12-hour chart, it will confirm the recovery thesis that all four indicators are reinforcing. Conversely, if it fails to hold the 2,086 USD level, the recovery plan will be delayed, and Ethereum's price may re-test the support area at 1,935 USD.