Basic rules:
EMA20 > EMA50 > EMA200: Uptrend --> prepare to LONG
EMA20 < EMA50 < EMA200: Downtrend --> prepare to SHORT
EMAs crossing erratically: Sideways --> stay out
Trend reversal:
EMA20 crosses EMA50 --> early signal
Must break & hold above/below EMA200 --> confirmation needed
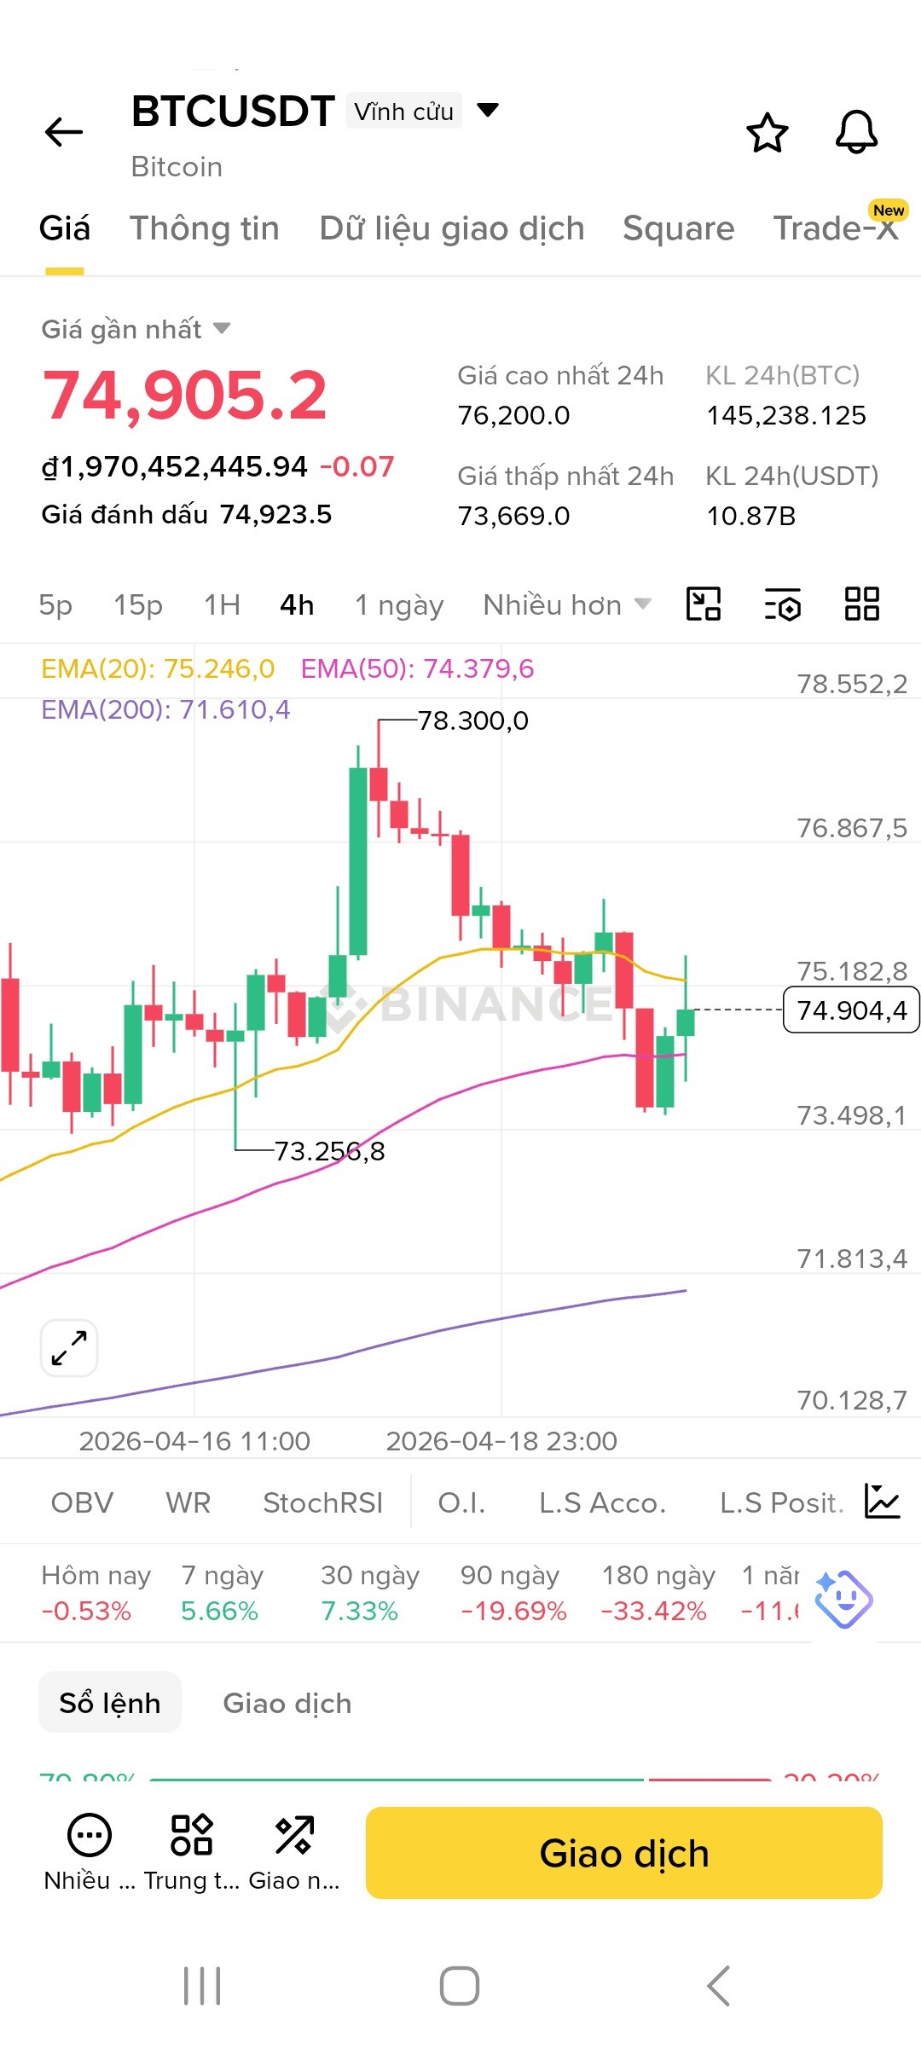
Real-world example – see the chart below
EMAs still stacked: 20 > 50 > 200 --> uptrend not broken
But price falls below EMA20 --> short-term weakness
Price hits EMA50 then bounces back --> testing support
👉 Conclusion:
Trend is still bullish, but it's pulling back to the EMA50 to gain momentum.
👉 Quick reminder:
EMA20 = fast (easily faked)
EMA50 = key support zone
EMA200 = major trend
** Technical analysis isn't about winning every trade, but about not trading blind.
It's like a blind person's cane - it doesn't help you move the fastest, but it helps you stay on the right path and avoid major mistakes.
🫠 This post is for sharing only, not investment advice. You're responsible for your own financial decisions.
 BTC63,451.48+0.86%