As of April 20, 2026, Ethereum (ETH) is showcasing a "textbook" technical recovery, successfully shaking off the bearish pressure that dominated the second week of the month.
Ethereum (ETH) Market Analysis
1. Price Movement & Trend
Current Price: Approximately $2,172.
Steady Ascent:
After bottoming out near $2,020 five days ago, ETH has climbed roughly 7.5%. It has reclaimed the vital $2,100 and $2,150 levels, which have now flipped from resistance back to support.
Network Performance:
Ethereum’s gas fees remain surprisingly low despite the price increase, as Layer-2 adoption (Base, Arbitrum, and Optimism) continues to capture over 96% of high-frequency transactional volume.
2. Technical Outlook
Immediate Resistance:
ETH is currently testing the $2,185 resistance zone. A sustained break and daily close above this level would signal a clear path toward the $2,350 high-water mark set in mid-March.

Support Base:
The $2,100 level is now the primary short-term support. The deeper $2,020–$2,050 zone acts as a formidable "institutional floor" where accumulation remains high.
Momentum Indicators:
The daily RSI has moved back into the 54–56 range, suggesting a shift from bearish-neutral to bullish momentum. There is still significant "headroom" before the asset reaches overbought territory.
3. Institutional & On-Chain Drivers
Supply Crunch:
On-chain data indicates that exchange reserves of ETH have hit a new all-time low. This "liquidity vacuum" suggests that if demand spikes, the price could experience an explosive upward move.
ETF Influence:
The continued success of yield-bearing Ethereum ETFs is providing a steady daily bid. These funds are effectively removing circulating supply from the market, creating a long-term "supply-shock" narrative.
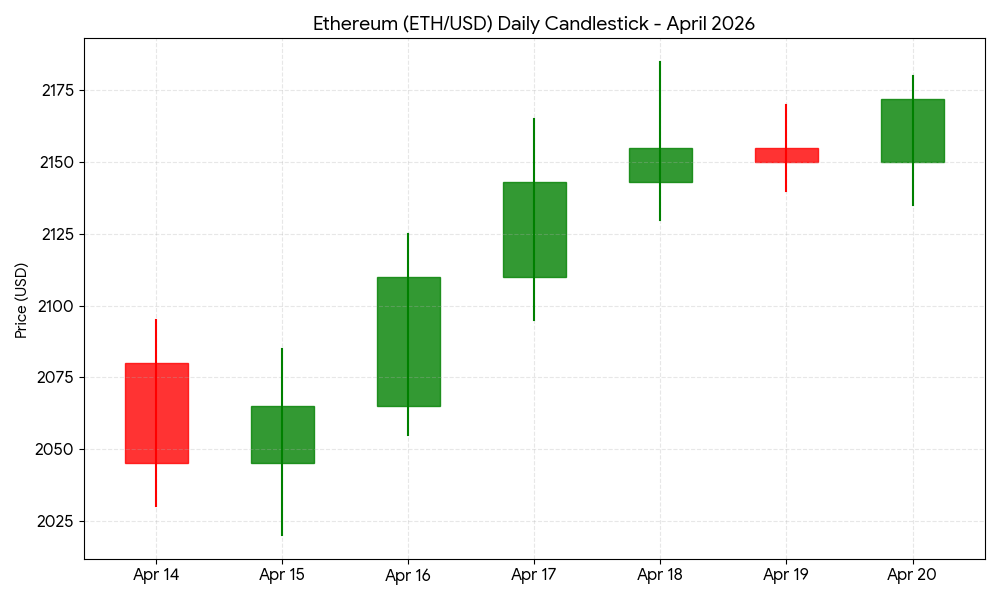
ETH/USD Daily Candlestick Chart (April 14 – April 20, 2026)
The chart below tracks the recovery trend over the past week, showing five consecutive days of higher lows.
Strategic Summary:
Ethereum is currently one of the strongest "large-cap" assets in the market. While Bitcoin is still battling consolidation, ETH's "V-shaped" recovery suggests it may lead the next market leg. For short-term traders, the $2,185 break is the key signal to watch. For long-term holders, the structural defense of the $2k mark has significantly bolstered the bullish case.