Technical Setup Cheat Sheet
The "Buy" Confirmation Checklist
Price Action: Asset makes a "Higher Low" on the 4-hour chart.
Volume: Breakout occurs with at least 2x the average 24h volume.
RSI: Currently in the 45–60 range (showing strength but not "overbought").
MACD: Bullish crossover on the Daily or 4-hour timeframe.
The "Sell/Exit" Warning Signals
Bearish Divergence: Price makes a new high, but RSI makes a lower high.
Resistance Rejection: Long upper wicks (Shooting Stars) at major resistance levels (e.g., SOL at $100).
ETF Outflows: For BTC/ETH, watch for consecutive days of net-negative institutional flows.
3. Strategic Risk Management
Position Sizing: In this high-volatility environment, limit total portfolio exposure to any single altcoin (SUI, HYPE, SOL) to 5-10%.
Stop-Loss Placement:
Conservative: 2% below local support.
Aggressive: Just below the previous day's low.
Profit Taking: Don't be a "moon-boy." Take 25% off the table at major resistance levels (Resistance 1) and move your stop-loss to entry.
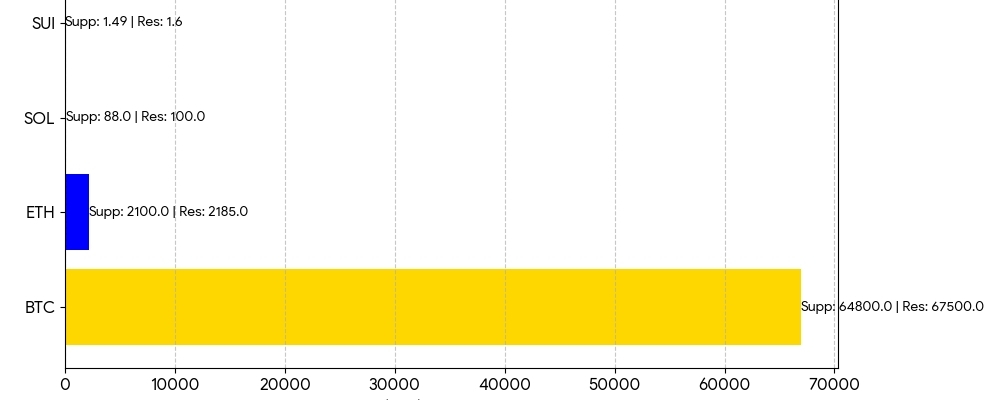
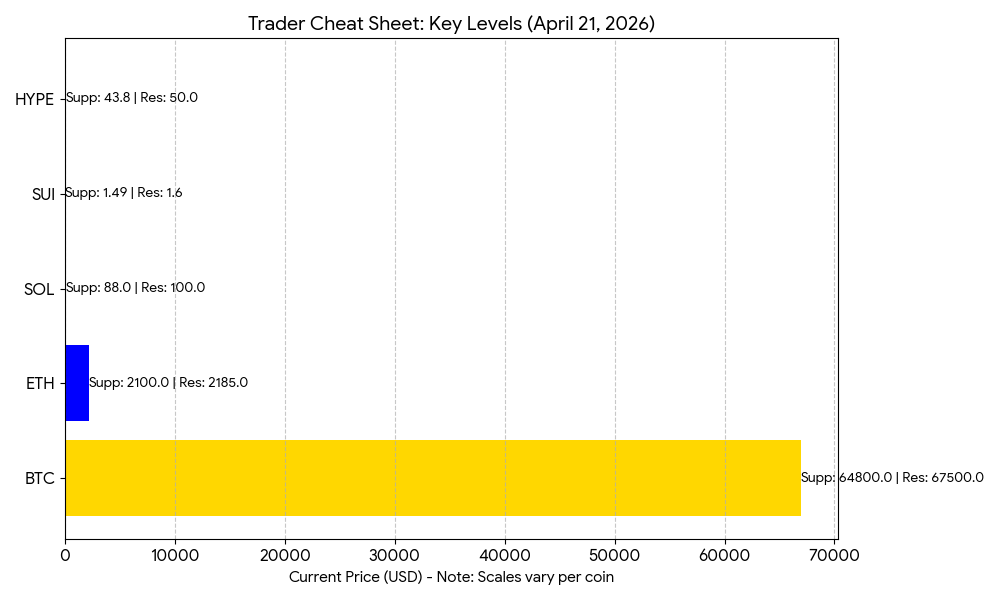
4. Visual Quick-Reference
The chart below highlights the current proximity of each asset to its major resistance hurdle.
Final Pro-Tip:
Watch Bitcoin Dominance (BTC.D). If BTC goes sideways and BTC.D drops, that is the green light for SUI, SOL, and HYPE to make their biggest moves of the week. Trade safe!