the parabolic explosion—why caution is your best friend right now $RAVE 🚀⚠️
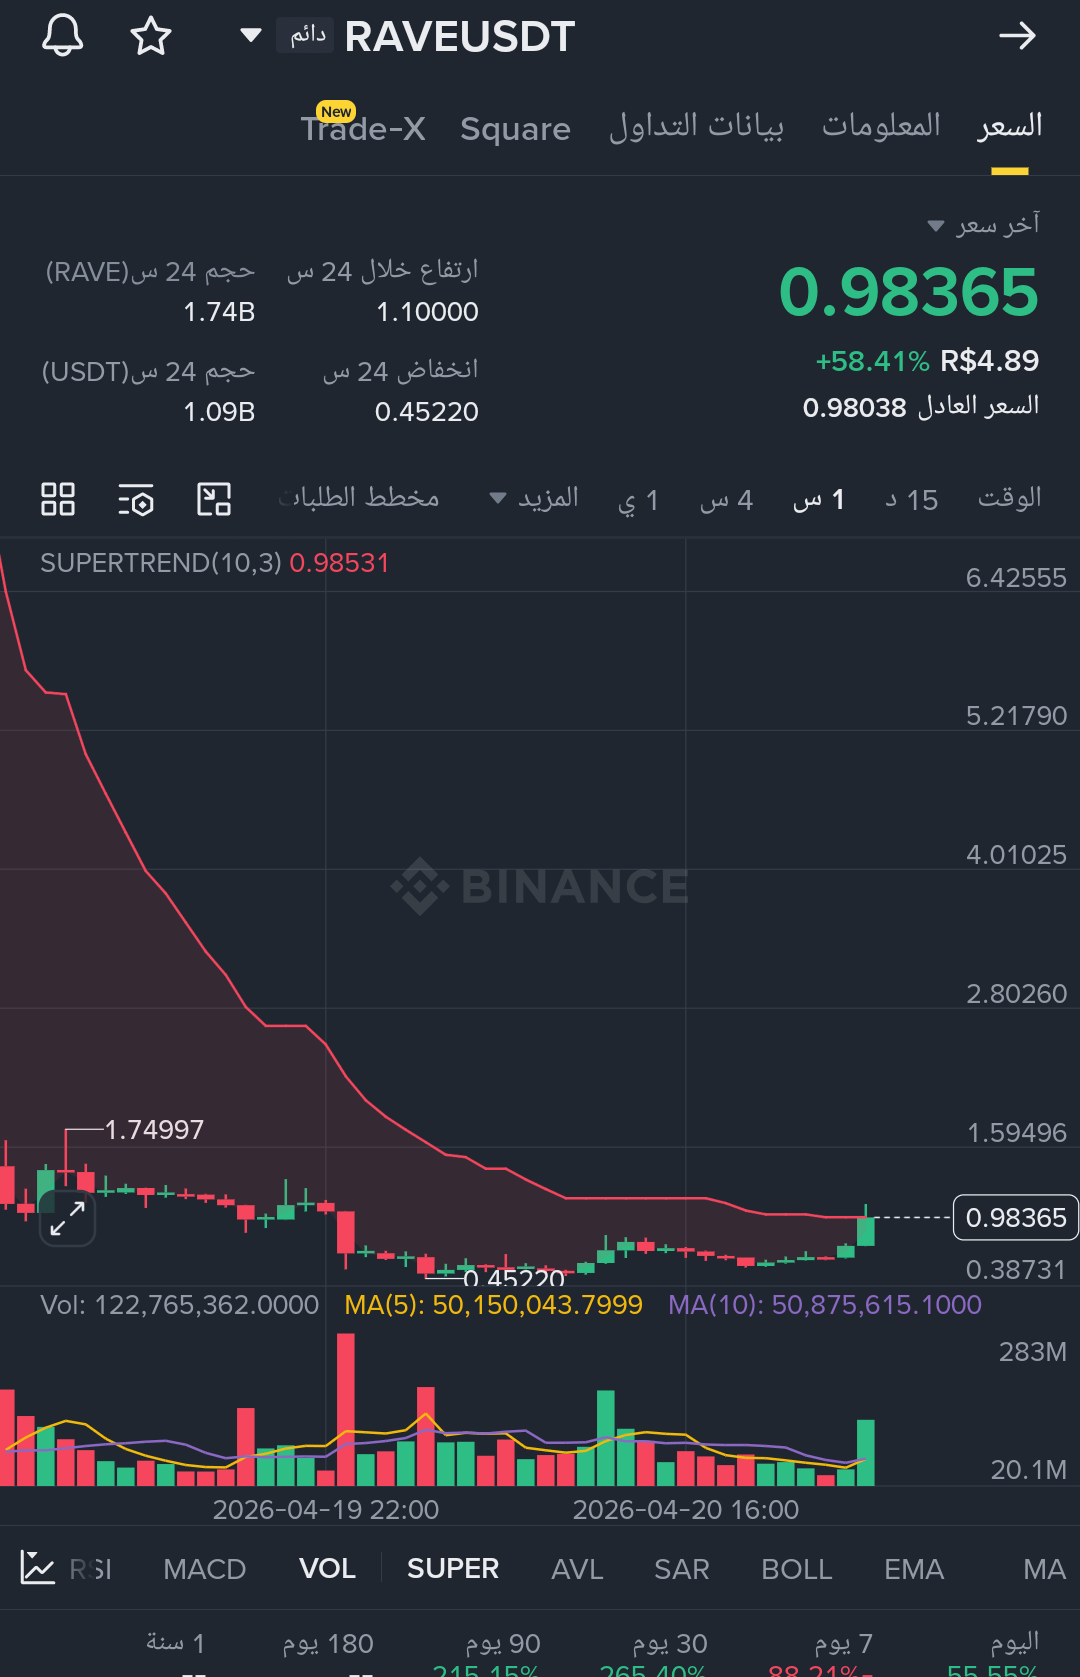
$RAVE shows a tremendous volatility, currently trading at a price of $1.07840 with an astonishing increase of 72% in the last 24 hours. The charts indicate a parabolic movement, driven by high momentum as shown by the MACD divergence. However, the technical indicators are screaming warnings for all traders.
Technical Outlook:
Extremely Overbought Signal: The Relative Strength Index (RSI) (6) is currently at 97.80. In technical analysis, an RSI above 80 is considered deeply overbought, and nearing 98 is a severe divergence. This suggests that the asset may have "stretched" to its maximum, and the likelihood of a sharp correction or cooling-off period is very high.
Momentum: While the MACD indicates strong bullish momentum, these vertical moves rarely continue in a straight line without retesting lower support levels.
Strategic Horizons for Followers:
Do not chase the pump: Buying at these levels carries high risks. Parabolic moves often end with sudden liquidations.
Taking Profits: If you are already in a position with significant gains, consider taking partial profits to secure your win.
Wait for a retest: The current price is too far from the moving averages (MA7 at ~$0.84). A healthy market often retraces to these dynamic support levels to "catch its breath" before establishing a new trend.
Risk Management: If you insist on trading in this volatility, use very tight stop-loss orders. Never trade with money you can't afford to lose, especially on assets that show extreme vertical jumps.
Disclaimer: This is not investment advice; it is merely an opinion, and we are not responsible.
#USInitialJoblessClaimsBelowForecast