$RAVE In the financial market, Fibonacci retracement is a high-risk Technical Analysis tool used in an attempt to anticipate price movements and potential correction points during a trend, with the aim of positioning buy or sell orders for assets.
If you study or have started to become interested in Technical Analysis, you must have noticed the numerous indicators and tools to measure and project price movements, right? Many of them use numerical concepts and theorems for that.
Mathematics and statistics are intrinsically linked to Technical Analysis.$EDU
In this article, we will get to know one of the most used tools by operators on trading platforms: the Fibonacci retracement.
You will learn what it is, how it works, and how it is applied to try to anticipate the next market movement, what the Fibonacci levels are, as well as what types of orders can be sent. Shall we go?
What is the Fibonacci number sequence? $UAI
Before we understand how the Fibonacci retracement is used in Day Trade and Swing Trade, we need to learn where this strategy comes from.
The Fibonacci sequence is one of the most famous in mathematics. The theory was developed by the Italian mathematician Leonardo Fibonacci (1170-1250), consisting of a series of numbers where, starting from 0 and 1, the next numbers will always be the result of the sum of the two previous ones. Therefore:
0, 1, 1, 2, 3, 5, 8, 13, 21, 34, 55, 89, 144, 233, 377, 610, 987, 1597, 2584…
From this reasoning, he arrived at the 'Golden Rectangle' (see image below), where an arc called the 'Fibonacci Spiral' can be drawn following, starting from number 3, an approximate coefficient of 1.618 (the division of a number by its predecessor).
Such value is also called Phi number. The further you go in the sequence, the closer you get to this coefficient.
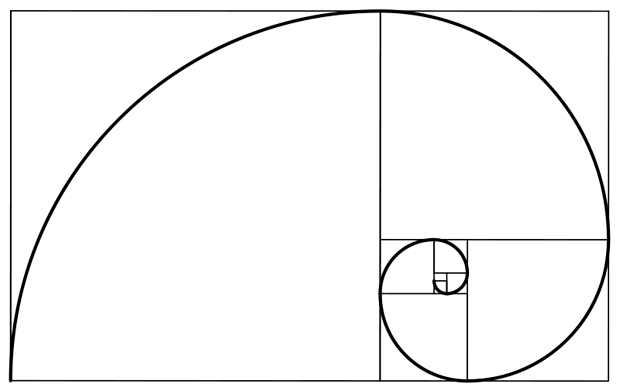
But how is this mathematically relevant? The number 1.61803398875 is known as the 'golden number' or 'golden ratio', often recurring in architecture, design, and the arts as more pleasing to the human eye and used as a metric for perfect solutions.
Countless examples can be cited, such as the Mona Lisa, the tail of a chameleon curled up, a circular staircase viewed from above, snail shells, the growth of an elephant's ivory tusks, proportions in the human body, among others.
What is the Fibonacci retracement?
In the financial market, the Fibonacci retracement is a Technical Analysis tool that uses the mathematical interpretation of the famous mathematician's sequence to build a direction or correction indicator for price movements.
It is used to identify points where the market has a chance to follow a trending movement or reverse it.
You already know that the Variable Income market moves in waves, creating ascending or descending peaks and troughs.
Before the next peak or trough, prices tend to make a correction to then continue the trend. The Fibonacci retracement serves to calculate and map this correction and position orders.
Next, see what the Fibonacci levels are and how to calculate them.
Calculation: what are the values of the Fibonacci levels?
Based on the Fibonacci sequence, in Technical Analysis, there are levels between 61.8%, 38.2%, 23.6%, and 0%. The Fibonacci study tools usually work at these levels.
In addition to these, other points are included as values where prices can react and change direction: 50% and 76.4%.
What is the strongest zone of Fibonacci?
But, faced with so many values, you must be wondering which is the most relevant, right? In theory, we can classify it as follows:
1. Light Retracements (23.6%)
They are the most common and occur faster, that is, they are of short duration.
2. Moderate Retracements (38.2%)
The intermediate ones are moderate retracements, that is, when the price retraces to the 38.2% range and loses intensity, returning to the initial movement.
3. Golden Retracements (61.8%)
These are the strongest retracements, but less common. When the price retracement approaches 61.8%, it reaches the 'golden number' of the theorem.
Alert Zone
Finally, it is also important to pay attention to alert zones, the points where the trader can identify potential reversals, supports, and resistances.
How to use the Fibonacci retracement in trading?
The best way to use this tool usually occurs after a significant uptrend or downtrend in the market.
In lateralization/consolidation situations, where prices do not move in a trend, the Fibonacci retracement is not effective.
Remembering that it is possible to use it in various time frames, meaning, as long as a trend in one of the two directions is detected.
In practice, just follow these steps:
In Profit Toro Trader, click on the Fibonacci retracement tool.
Mark the start of the movement by clicking on the point where the uptrend or downtrend began.
Mark the end by clicking on the point where the uptrend or downtrend ended before the price correction began.
By doing this, the tool will show you the lines drawn based on the Fibonacci calculation. In uptrends and downtrends, the types of operations will be different. Check it out:
Fibonacci retracement in uptrends
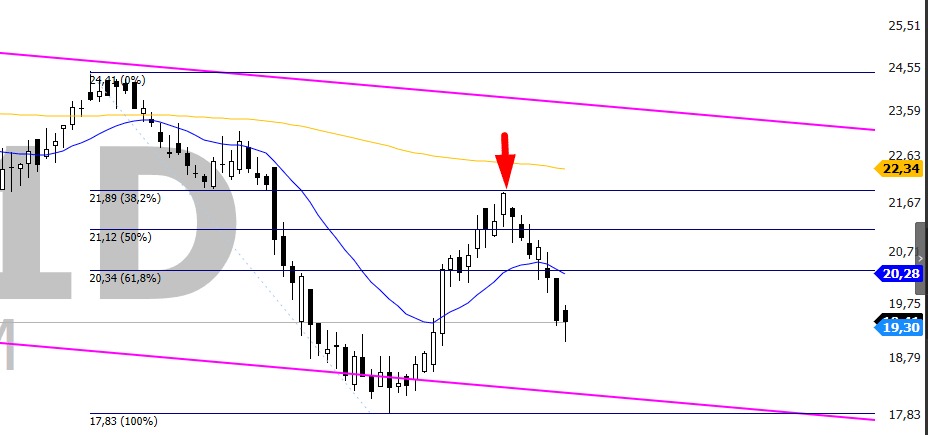
When the trend is upward, the retracement is used to try to see a support point for new purchases.
It works like this: after a bullish wave, traders expect the market to make a correction to then continue the upward movement.
At the moment prices start to correct, measuring the distance between the last low and the last high, quotes can retrace to the 38.2%, 50%, or 61.8% points.
At these levels, viewed as supports, traders think about positioning new purchases, catching the new upward movement and trying to reach the previous peak.
Stops can be placed at intermediate points after the 61.8% level, depending on your risk management strategy.
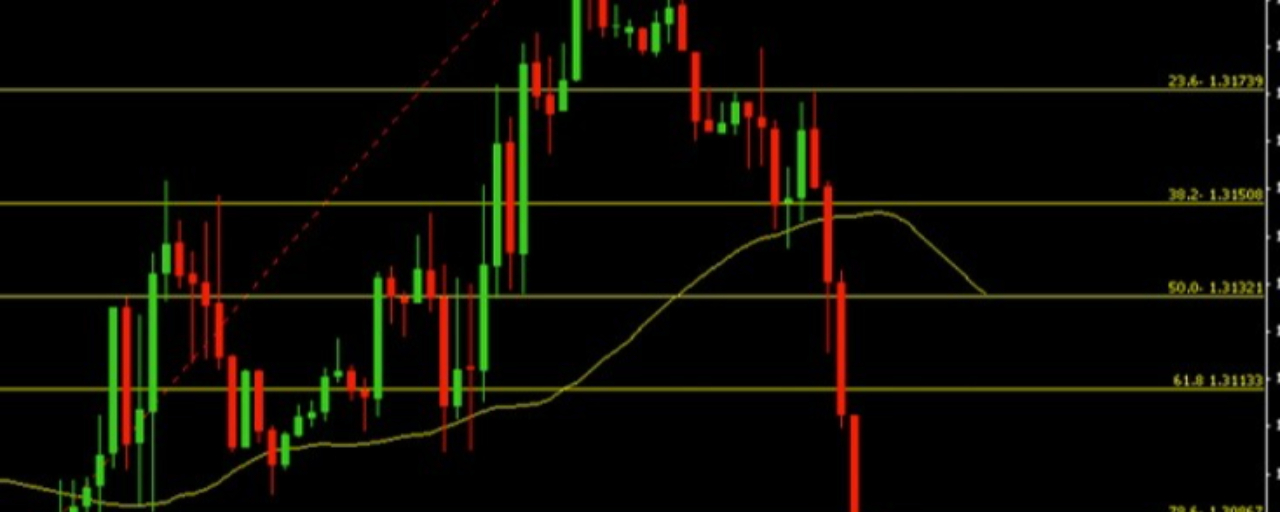
Fibonacci retracement in downtrends
When the trend is downward, the retracement is used to detect potential new sales and resistance areas.
After a drop, prices may make a correction movement. Then, just measure the amplitude of this movement from the previous peak to the trough using the Fibonacci retracement tool.
The points of 61.8%, 50%, and 38.2% are seen as new resistances, and traders can then position sell orders.
The stop points are also defined according to your risk management. Check the following image for an example of a Fibonacci retracement after a downtrend.
In this situation, there was a correction of prices up to the 38.2% point to then continue the initial movement. The target of the operation is usually the previous low (100%).
What is the difference between Fibonacci retracement and projection?
Before we finish, another important differentiation that the trader needs to master is the difference between Fibonacci retracement and projection.
As I said, the Fibonacci retracement is the study to identify possible regions of support or resistance, that is, how far the price can correct after a movement up or down.
In an up movement, for example, the Fibonacci is drawn from bottom to top until the end of the movement.
The lines, therefore, will indicate the main points where the price tends to correct and follow the same direction as the initial movement. In down movements, just do the opposite.
The Fibonacci projection is used to map potential market targets within a trend.
For example: first the trader can identify and trace a down move followed by an up leg. Then, the platform will project possible targets in the direction of the first movement based on the Fibonacci calculation.
At these price levels, potential supports can also be formed. In downtrends, just reverse the reasoning.
Remember that no indicator should be used in isolation. Therefore, it is recommended to refine and confirm the analysis with other technical instruments and Dow Theory.

