⚠️ Daily Technical Analysis of the Crypto Market | 22.04
$RENDER /USDT — hard signal assessment
What's the situation right now
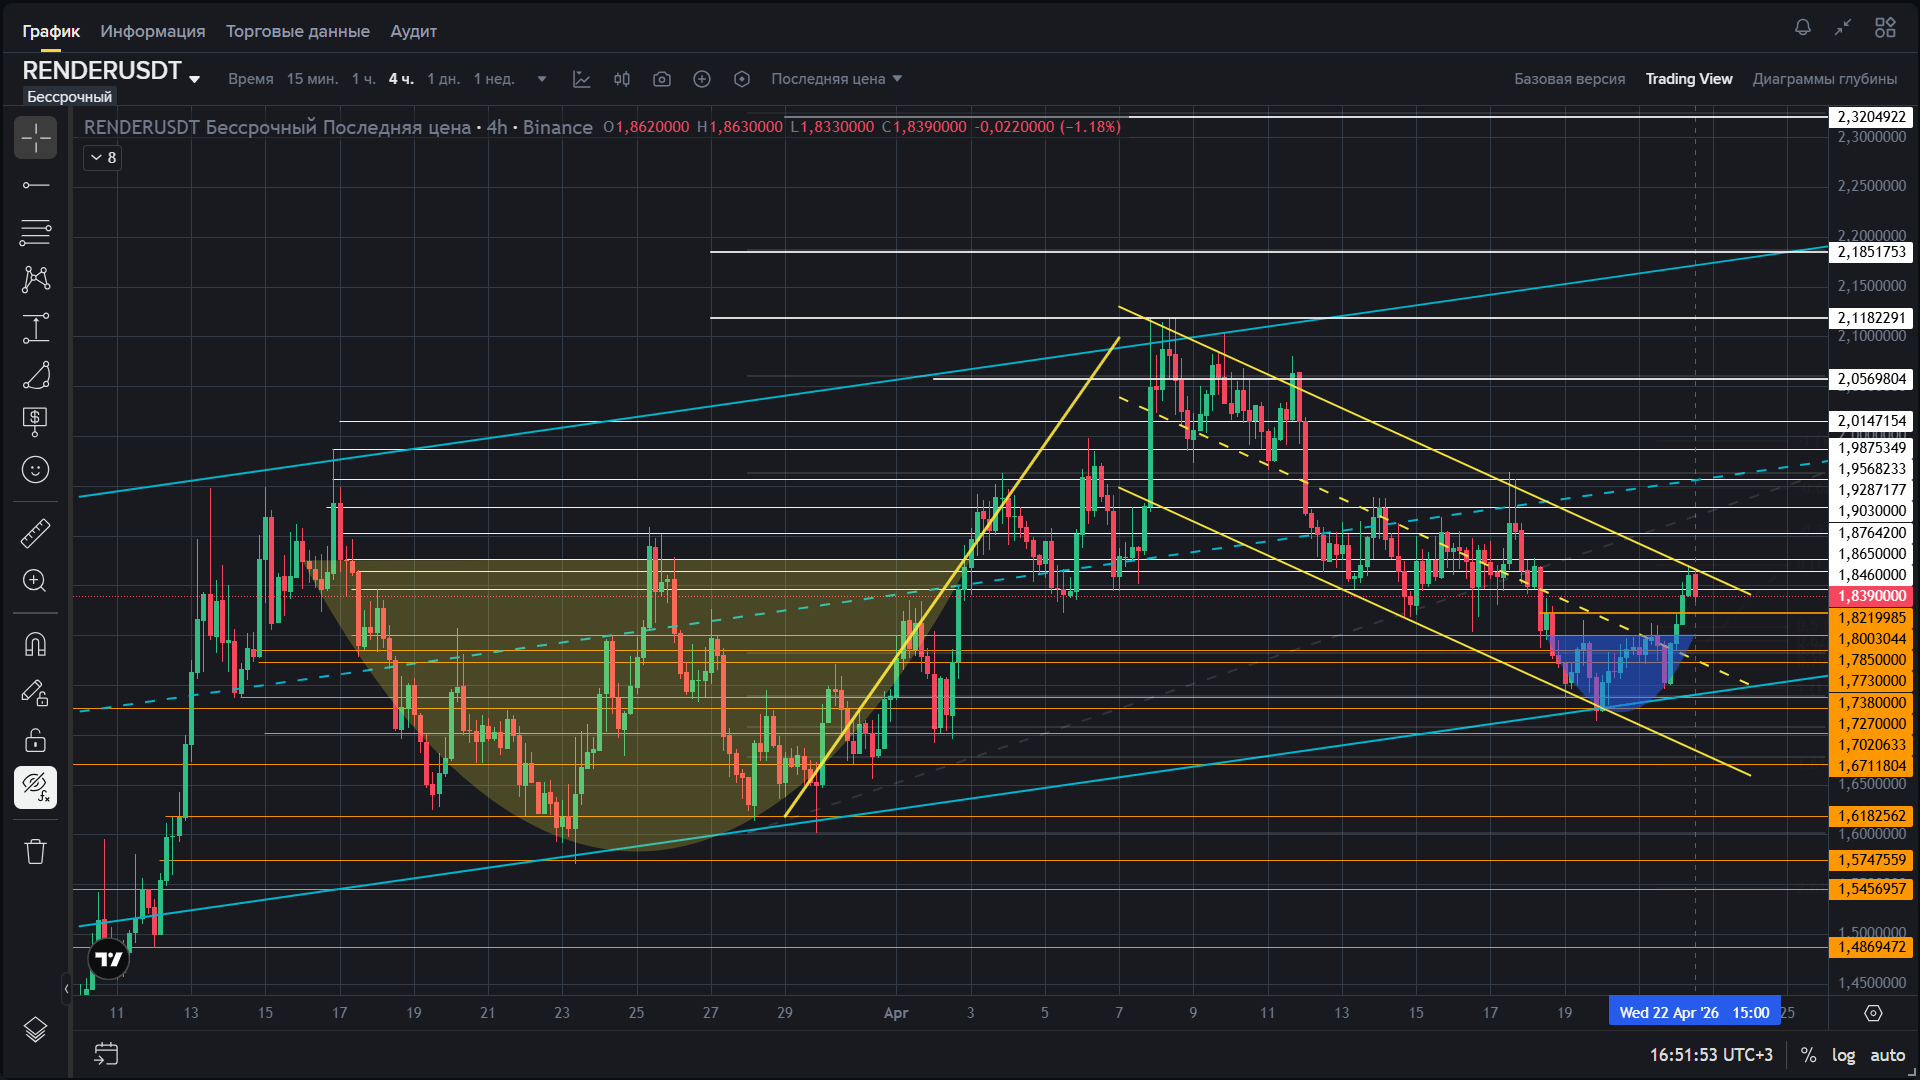
— price: ~1.84–1.86
— market cap: ~$930–956 million
— volume: ~$71–82 million
— asset status: neutral-strong, but no overhead buffer
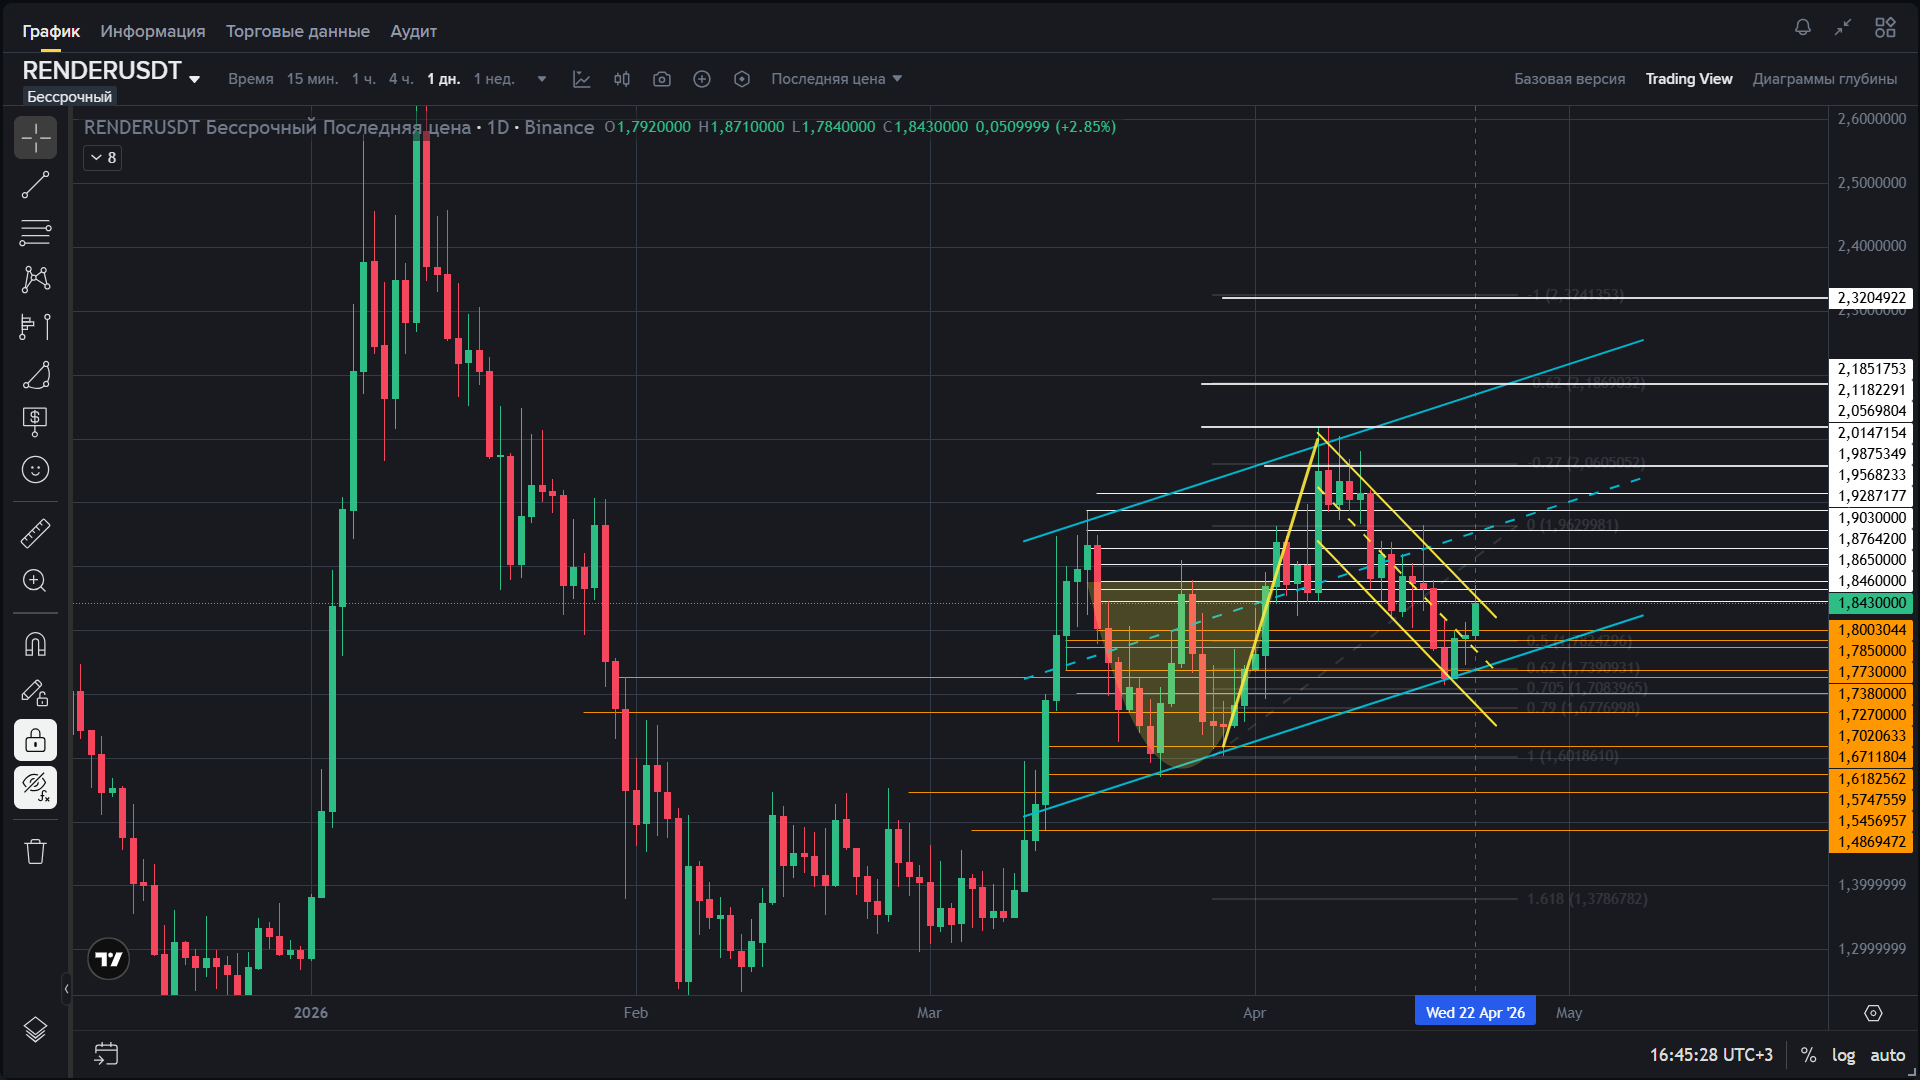
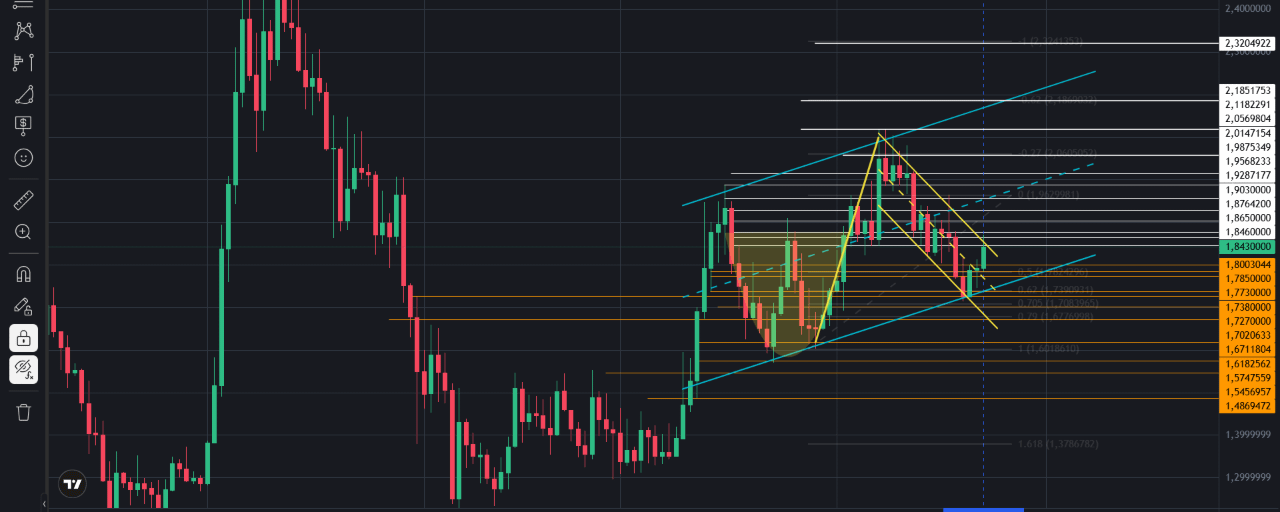
— 1D structure: price is holding within a global uptrend channel, bounce came from the lower boundary
— 4H structure: locally, the asset has hit the upper pressure zone after a bounce, the market is no longer at an easy entry point
— money flows: mixed, spot looks better than derivatives in the overall picture from your screenshots
— dominated by: locally a buyer, but right under the seller
Conclusion:
The asset isn't weak. But it's not free either.
This is not a phase of a simple long in the market right now.
Currently, this is a testing phase: will they hold the structure up or flood it again under resistance.
________________________________________
1. Price forecast
Short-term
Priority: long, but only as long as they hold the structure
Basic movement model:
— either they continue to push the price into the upper liquidity zone
— or they get rejected by the seller and return the asset back to support
Medium-term
— structure is maintained as long as the price stays above the key holding zone below
— the downward reversal begins if the market breaks this zone and stops holding the bounce logic from the lower channel boundary
________________________________________
2. Key levels
Support:
— nearest local zone: around 1.80
— key holding zone below: around 1.77–1.768
Resistance:
— nearest seller zone: around 1.846–1.876
— critical cancellation zone of current pressure from above: around 1.90+
________________________________________
3. Scenarios
Long:
— let's say
— only if the market holds support and doesn't break the lower structure zone
— the long logic now isn't about buying on growth, but about working from support
Short:
— not the main one
— makes sense only if the price loses the key zone below
— shorting just because 'it has already gone up' is a dumb mistake
________________________________________
Main scenario — long
Probability: 58%
Alternative scenario — short
Probability: 27%
Range
Probability: 15%
________________________________________
Result
The asset is alive.
There is a local buyer.
But it sits right under the seller.
Right now, the priority is a long from support, not an emotional long.
Weaker and riskier now — late entry into a rise under resistance and early short without breaking structure.
________________________________________
Final conclusion
RENDER doesn't look like reversal junk or pure impulse right now.
This is an asset in a working bullish structure that has entered the testing zone.
The market decision right now is clear:
as long as they hold the lower zone — the bias is towards long.
If they break it — the long ends.
________________________________________
But the problem isn't in seeing this.
The problem is how to execute this.
Without a system, most here:
— will enter early
— will confuse a bounce with a reversal
— will move the stop
— will start looking for confirmation only after entry
— or just hang between 'still holding' and 'already breaking'
This is where they lose money.
Because RENDER only looks clear on the chart.
This is where things get messy: entry under the seller, fear of adding lower, hope to ride out the spike, then chaos.
________________________________________
📌 The scenario is calculated via the SYSTEM market analysis through ChatGPT.
Module foundation:
— liquidity
— levels
— flows
— large trades
This is not 'an opinion on the market'.
This is the structure of the trade.
________________________________________
If you need ready trades — If you want to understand where the entry, stop, and cancellation are — type 'SYSTEM'. Look through my profile: @INVESTIDEAUA | Click 'Find on Google' ➡️ Open channel