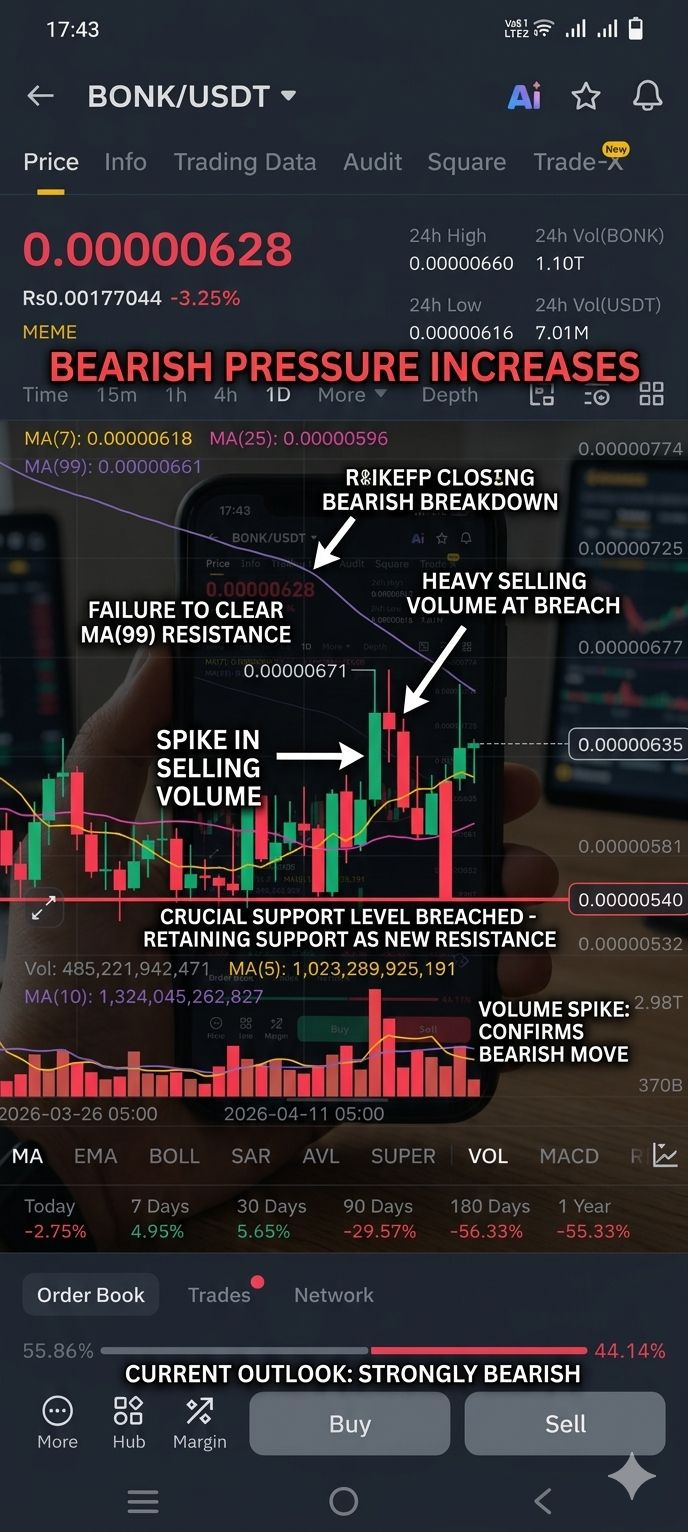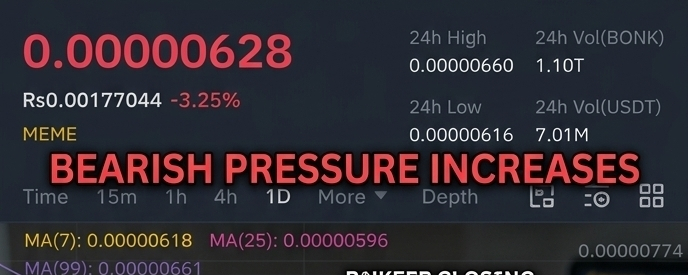
The $BONK /$USDT daily (1D) chart is showing some interesting price action. After a period of consolidation, the price is currently hovering around 0.00000635. Here is a detailed breakdown of what to expect next:
📊 Technical Insights:
Support & Resilience:
BONK has established a strong floor at the 0.00000539 level. Every time the price dipped near this zone, buyers stepped in, leading to a healthy bounce.
Moving Averages (MA) Battle:The price is currently trading above the MA(7) (Yellow) and MA(25) (Pink), which signals short-term bullish momentum.
However, the MA(99) (Purple) at 0.00000661 is acting as a major overhead resistance. A clean daily close above this line is required to confirm a trend reversal.
Performance Metrics:
While the 24h change is slightly down (-2.01%), the 7-day (+4.95%) and 30-day (+5.65%) figures show that BONK is slowly gaining strength despite the broader market volatility.
🔑 Key Levels to Watch:
Resistance (Target): The immediate hurdle is 0.00000661 – 0.00000671. If BONK breaks through this with high volume, the next targets are 0.00000725 and 0.00000770.
Support: Immediate support lies at 0.00000596. A drop below the 0.00000540 zone would invalidate the current bullish structure.
💡 Trading Setup:
For Bulls: Look for a confirmed breakout and retest above the 0.00000670 level before entering.
For Bears: If the price fails to break the MA(99) and volume stays low, we might see another retest of the lower support levels.
Final Verdict: $BONK is in a "wait and watch" zone. It’s showing strength, but the real rally starts once it clears the purple resistance line. Always use a Stop-Loss (SL) when trading meme coins!#Bonk #crypto