Price Action and Candlestick Analysis
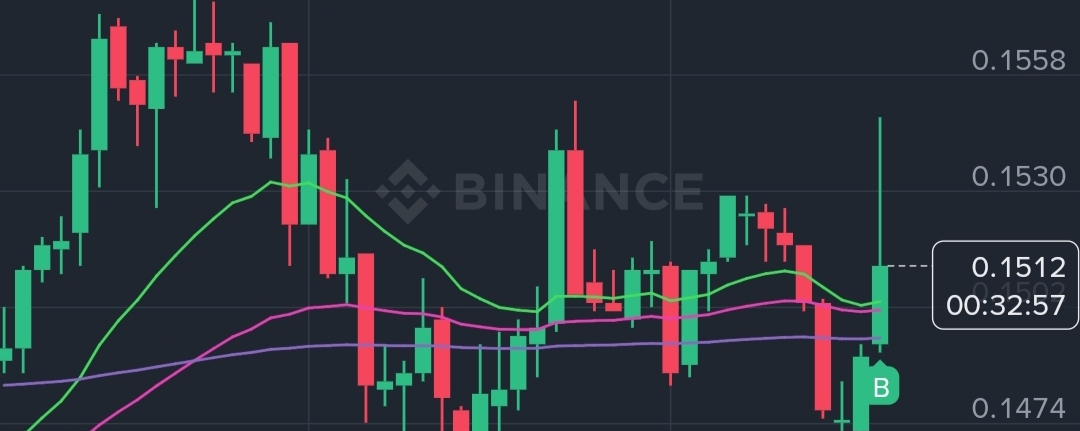
Recent trend: there has been a strong green candle (Bullish Engulfing) lately, indicating strong buying momentum at levels 0.1470 - 0.1480.
Nearby resistance: the price is facing resistance at the previous candle's peak around 0.1580.
Moving Averages (EMA)
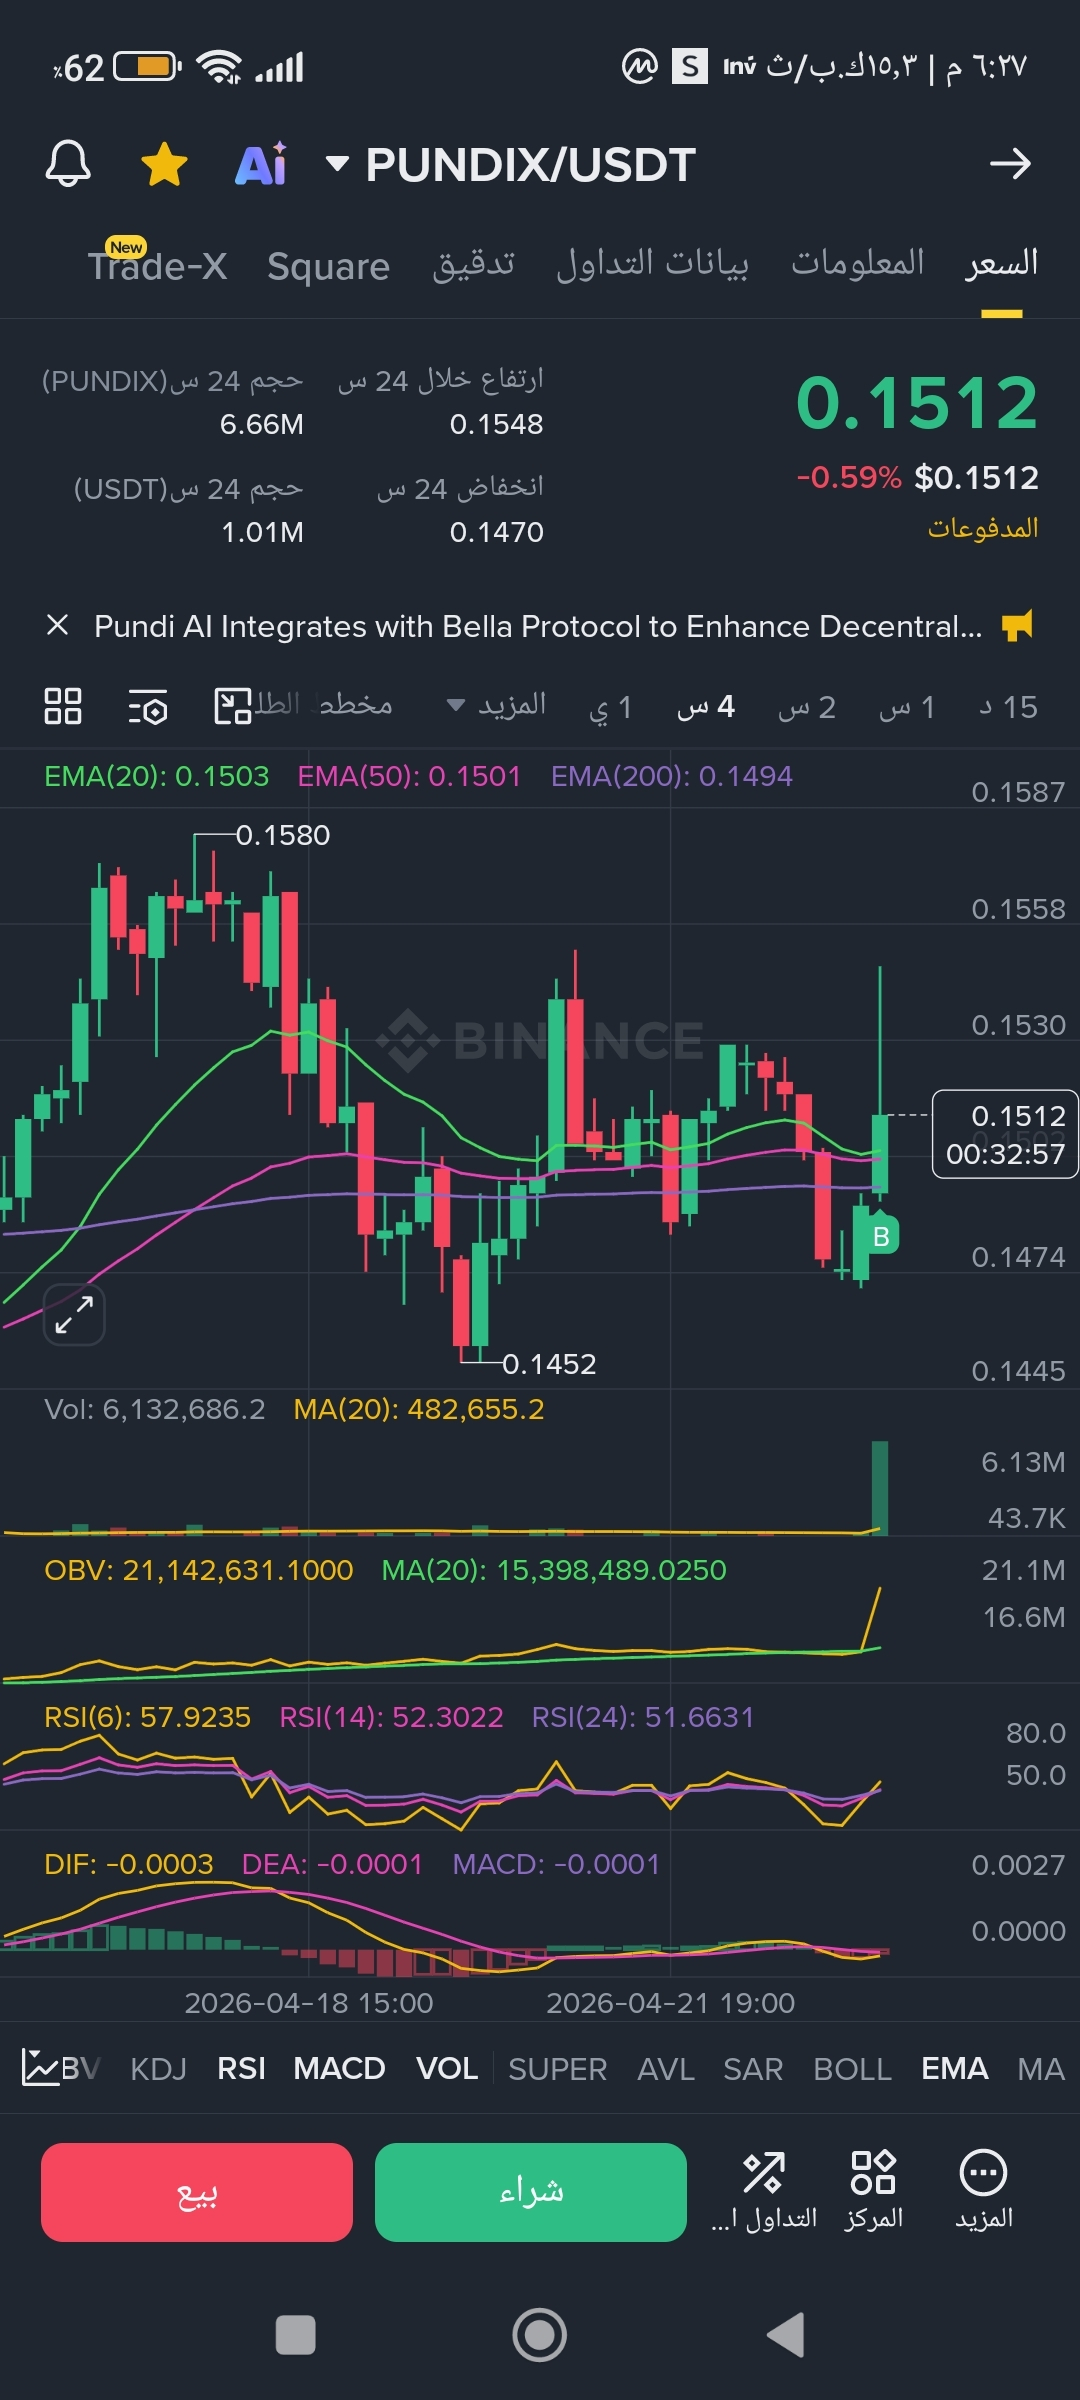
The price is currently trading above the moving averages (EMA 20, 50, 200) in the first chart.
Notice the convergence of the lines (EMA 20 and EMA 50); a breakout above them and stabilization is a positive signal for continued upward movement.
3. Relative Strength Index (RSI)
RSI(6): at 68 (approaching overbought territory).
RSI(14): at 58.
Analysis: The indicator is in a healthy zone (above 50), which means there is strength in the upward trend and no significant price inflation yet, providing room for more upside before a correction.
4. MACD and OBV indicators
MACD: We're starting to see a contraction in the red bars (selling momentum) turning into pale green, which indicates the possibility of a "bullish crossover" soon.
OBV (On-Balance Volume): There's a sharp rise at the end (the yellow line), and this is a very strong indicator because the rise is backed by real liquidity, not just price manipulation.#BinanceLaunchesGoldvs.BTCTradingCompetition #CHIPPricePump