🚨 RUG PULLED
📉 Disaster Breakdown: When the bullish trend evaporates in moments (expansion in the middle)
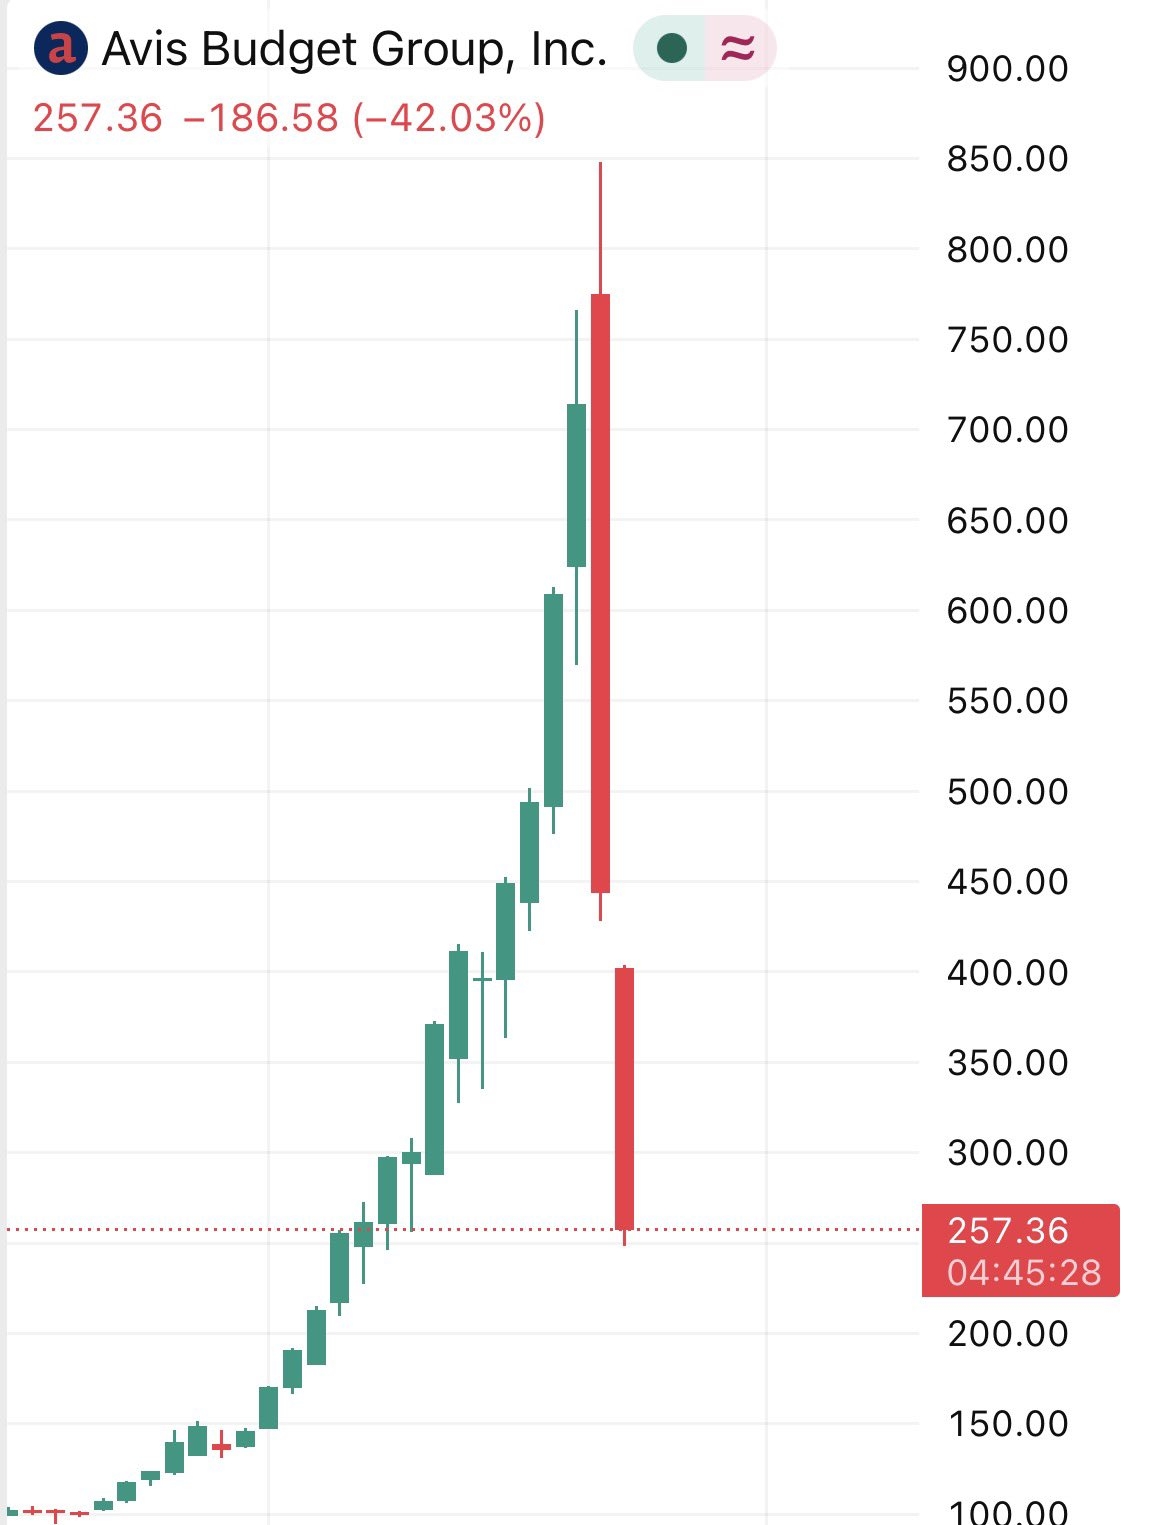
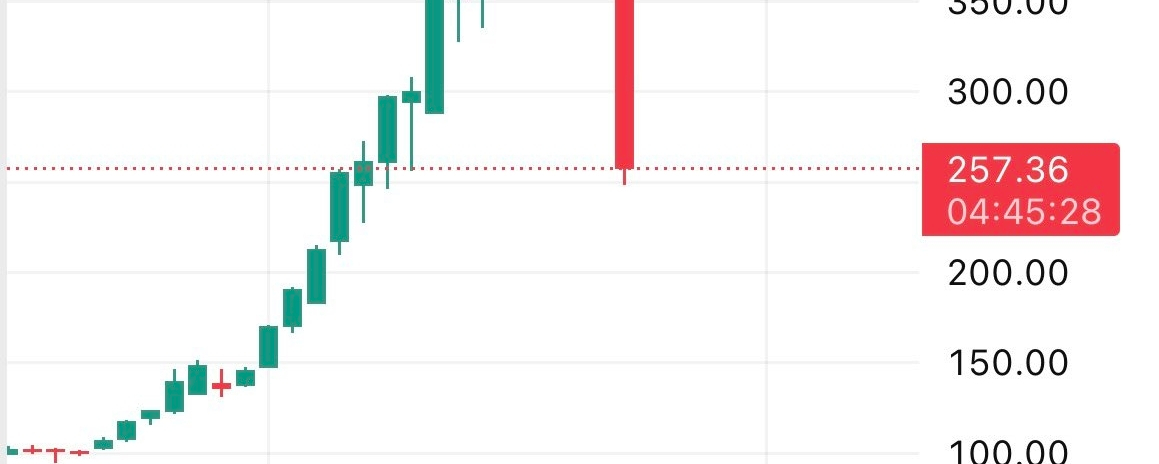
Looking at the attached candlestick chart for Avis Budget Group, we see a live embodiment of what's called a "vertical collapse." After a rocket-like ascent where the stock surged from the $100 level to a peak nearing $850, the unexpected occurred. The long red candle (Full Marubozu) shown in the image reflects a loss of 42.03% in a single session, shattering all technical support levels and leaving behind a terrifying "Gap Down." This isn't just a normal dip; it's a massive and violent exit of smart liquidity.
⚠️ What are the takeaways? (Expanded at the end)
One word sums up the scene: discipline
This post proves that the market shows no mercy to overly optimistic traders, and the next move of the stock faces complex odds:
1. End of the cycle: This crash often signals the end of a major bull run, where the stock shifts from a 'growth' phase to a long 'distribution' phase.
2. The trap: Any attempt to bounce back now could just be a 'Dead Cat Bounce' before continuing the drop towards the true bottom.
3. Comparison to crypto: While we see Ethereum (in the other picture) trying to build a base for an upward move, we see here how traditional stocks can sometimes be more volatile and risky than cryptocurrencies during a Rug Pull.
Summary: When you see a red candlestick this big breaking through the price and hitting $257.36 after a peak of $800, know that the rules of the game have changed, and safety lies in watching the chaos gaps from a distance before making any buy decisions.