In the financial market, not every movement calls for action, and the daily chart of Solana (SOL) is living proof of that. Right now, the asset is stuck in a technical no-man's land (neutral trend), trading in a sideways pattern that's been going on for weeks.
The Current Scenario:
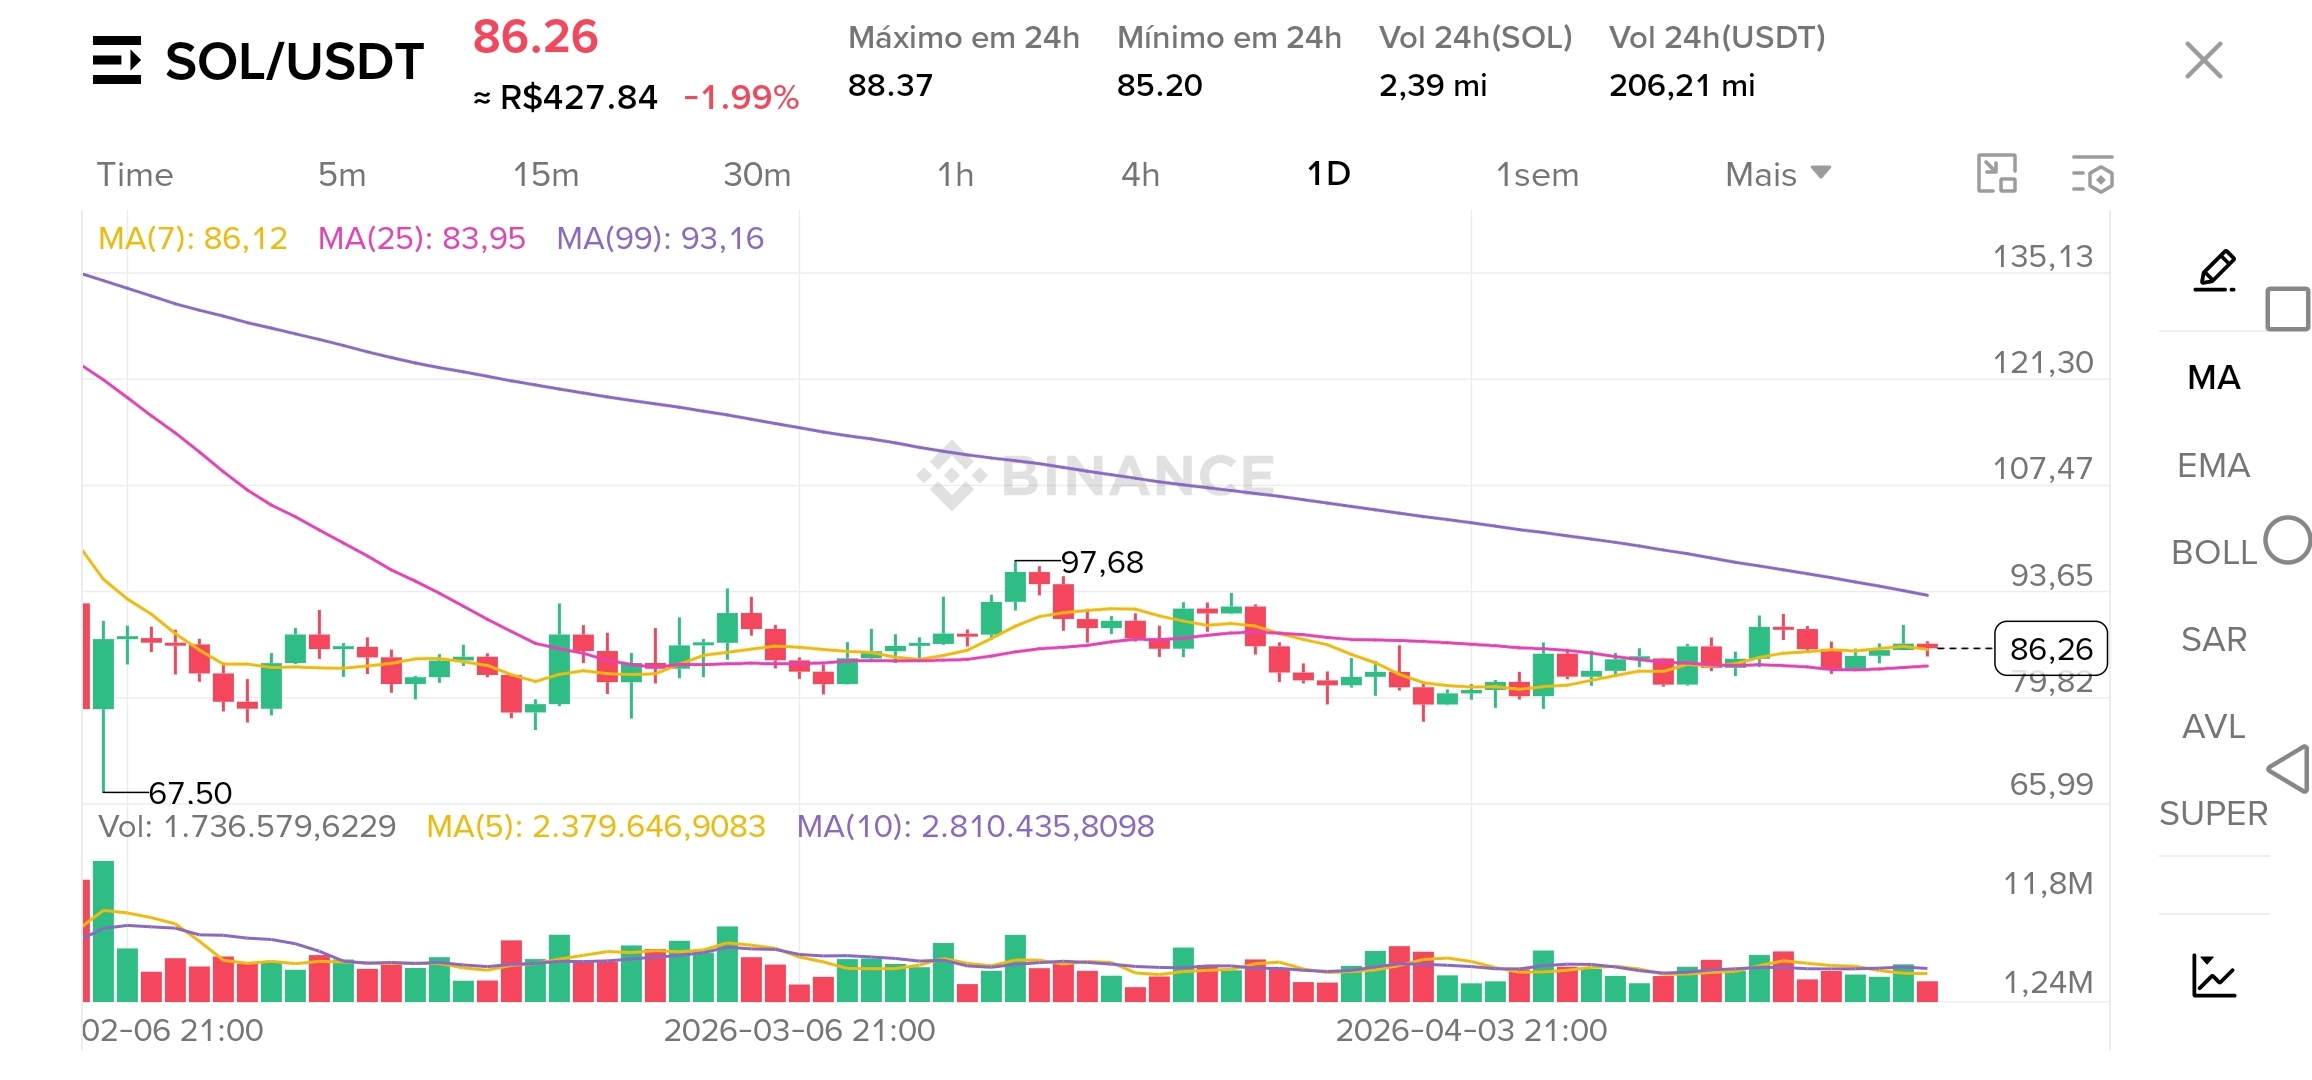
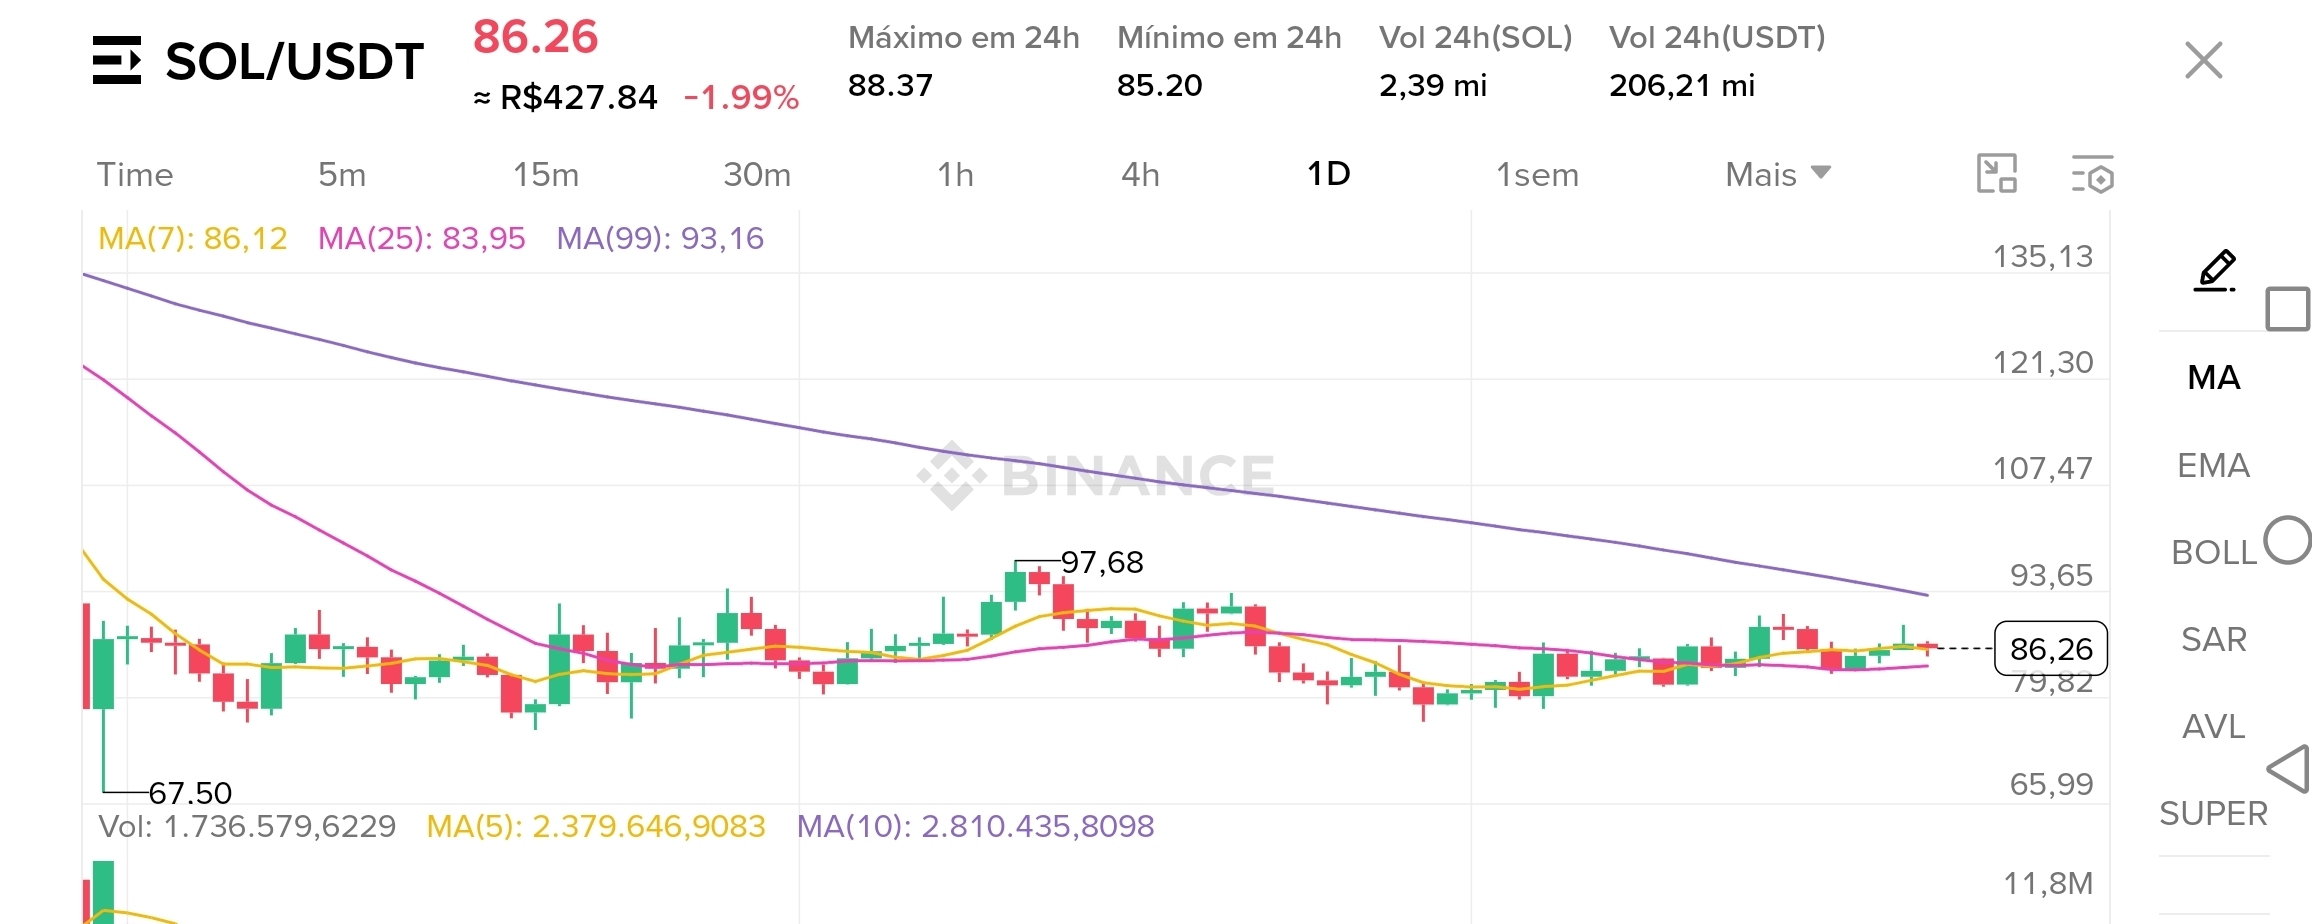
The price of $86.26 is 'squeezed' between the moving averages. While the MA(7) and MA(25) show a crossover with no directional strength, the 99-period average (MA99) acts as a psychological and technical upper barrier at $93.16. We're observing a structure of lower highs and lows that has stabilized, creating local support at $79.82 and immediate resistance at $97.68.
Trade Verdict:
Entry Point: There's no safe entry at the moment. Opening positions within this "box" increases the risk of a stop due to irrelevant volatility.
Strategy: Wait for a confirmed breakout of the MA99 ($93.65) for buys or the loss of support at $79.80 for potential shorts.
Trend Next 24h: Neutral. Volume is stable and there are no graphical catalysts for an immediate breakout.
Investing wisely also means knowing when to sit on the sidelines. The market rewards patience just as much as it does courage.
#Solana #SOL #CryptoAnalysis #TraderLife #MarketUpdate #Investments Blockchain.com $SOL $BTC $XRP #StrategyBTCPurchase #BTC100kNext #GrayscaleBNBETFFiling #JustinSunSuesWorldLibertyFinancial #BinanceLaunchesGoldvs.BTCTradingCompetition