How to Identify Trends (Part One: The Best Use of Averages)
From my perspective, this is the best way for traders to use averages; they aren't a strategy per se, but they give you a feel for the current market situation and help you make decisions.
Step One: We load 5 averages for the following uses:
Very fast: to monitor the candlestick and where it closes.
Fast: in conjunction with "very fast" we determine the strength of the trend.
Moderate: in conjunction with "fast" we determine the direction for the short-term.
Slow: in conjunction with "moderate" we determine the direction for the medium-term.
Very slow: in conjunction with "slow" we determine the direction for the long-term (to keep up with whales and investment funds).
Step two:
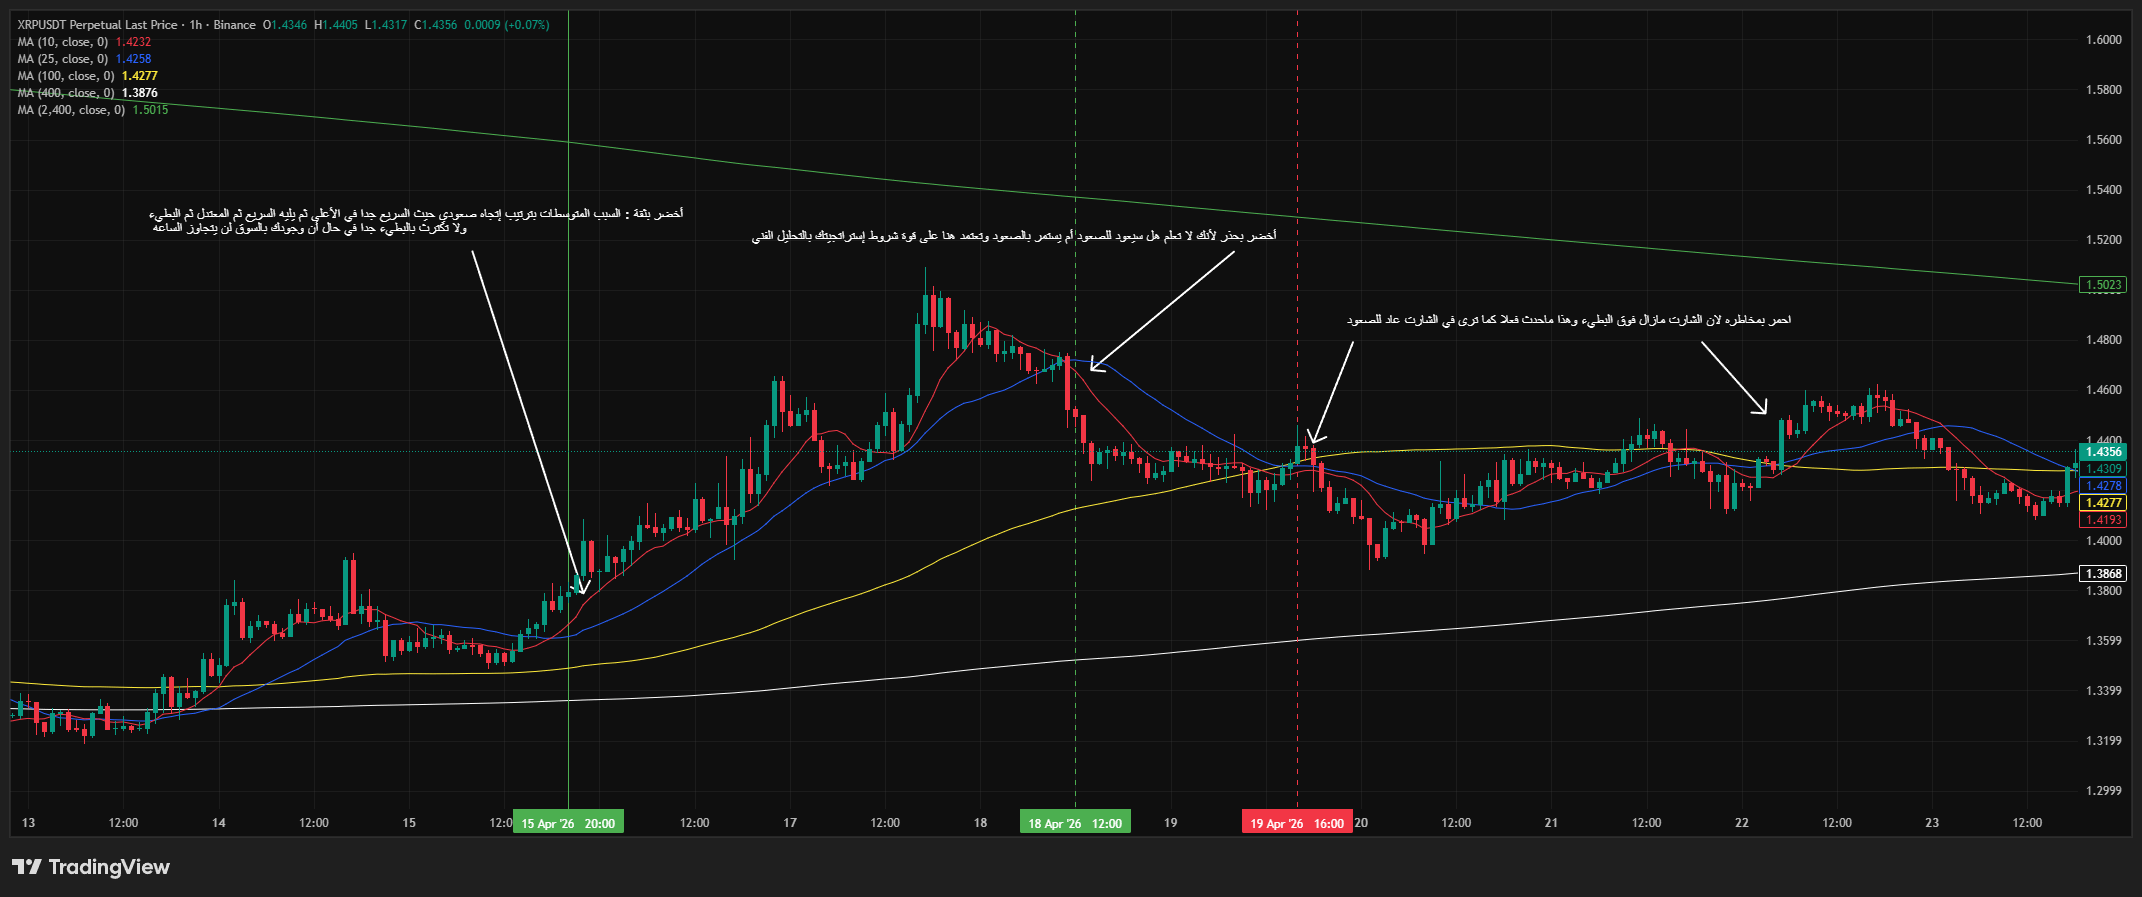
We determine the timeframe we're going to trade on, let's say "one hour", and set a 100 moving average as the standard "moderate" average, or any average you feel the market reacts to. The other averages mimic the 100 average but on different timeframes.
Illustrative example:
If we want to simulate the 100 average (for the 1-hour timeframe) on other timeframes, we perform the following calculation:
Very fast (simulating 5-minute timeframe): since the hour contains 12 units of 5 minutes, we divide 100 by 12 = 8.33 (rounding to 9).
Fast (simulating 15-minute timeframe): since the hour contains 4 units of 15 minutes, we divide 100 by 4 = 25.
Moderate (1-hour timeframe): remains at 100.
Slow (simulating 4-hour timeframe): we multiply 100 by 4 = 400.
Very slow (simulating 1-day timeframe): we multiply 100 by 24 hours = 2400.
👈 In the following image of #XRP, you'll notice how your market perspective becomes clearer after applying these settings.
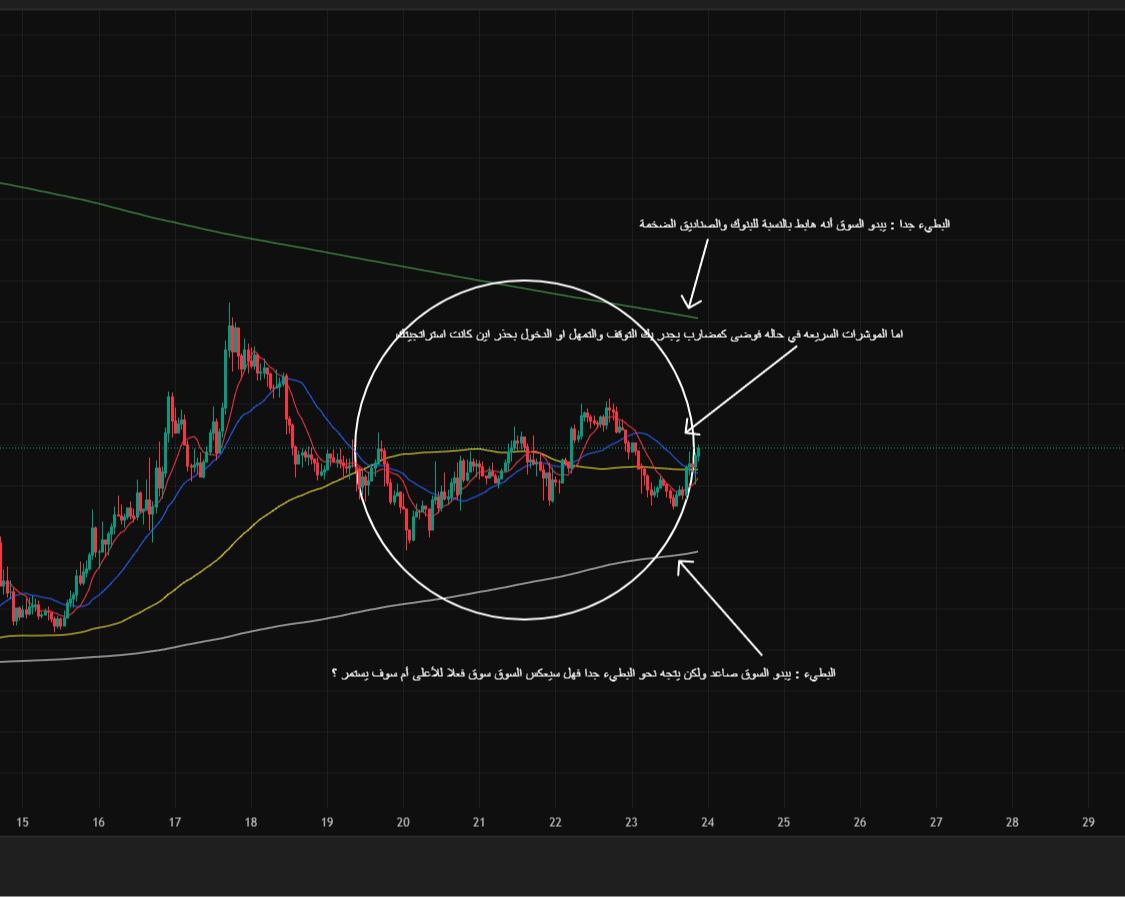
Step three: Use this method to determine the trend as a traffic signal as shown in the following image.
Confident Green: the situation says trade with full confidence and don't rush to exit.
Cautious Green: enter but with caution and exit quickly once you achieve the nearest possible target.
Risky Red: the situation is very dangerous but you can take the risk if all the conditions of the strategy you're following are met.
Red Forbidden: no matter how tempting the trade is, entry is strictly prohibited.
Remember that this method helps strengthen your decisions, but making it a strategy with intersections is a weak and risky strategy because it is monitored by whales who seek to break it, but it helps in making a decision for a sell or buy trade, and I advise you to do ... ......

Because it has high liquidity and has been stable for a while with high volatility.

