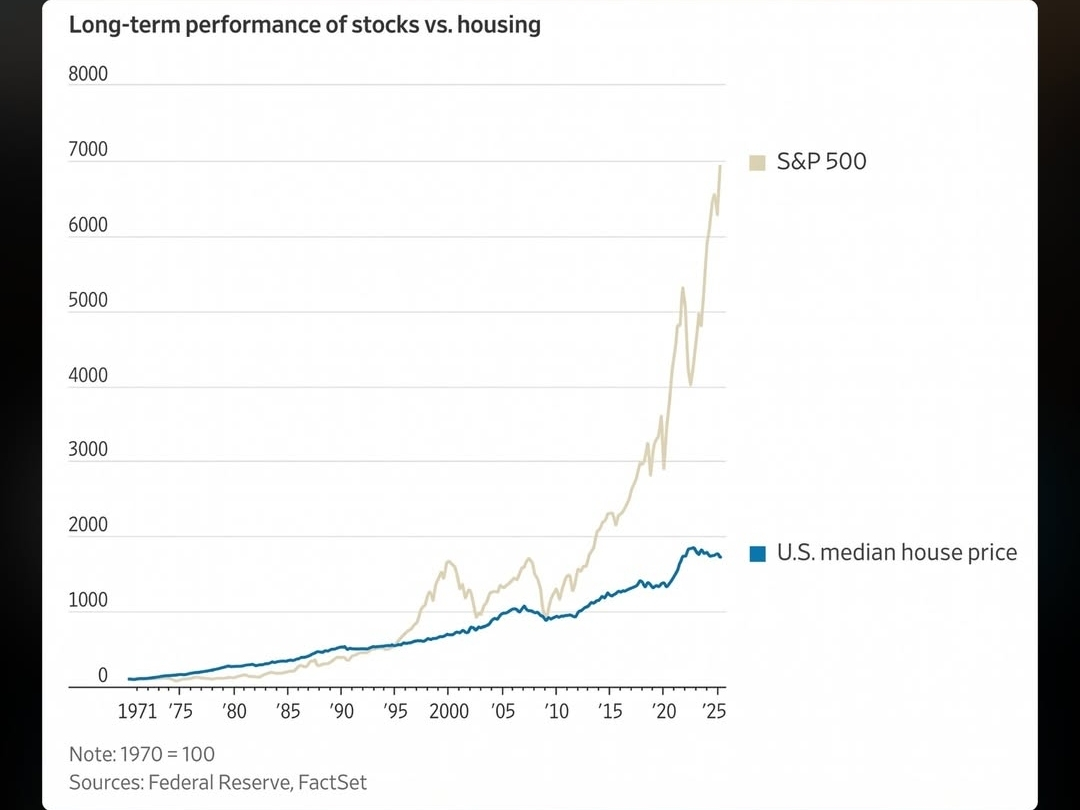
📊 Is it true that the S&P 500 outperforms real estate?
👉 Yes, historically that's correct… but with important nuances.
The S&P 500 has generated:
~10% annual average (≈7% real adjusted for inflation)
Housing in the U.S.:
~4–5% annual appreciation
👉 With those figures:
Stocks have grown faster than home prices.
That's exactly what your chart shows.
🧠 But here's the key point
1. 🏠 Real estate ≠ just the price of the house
The chart only measures:
👉 price increase
But in real life:
Rents generate income (approximately 3–5% net)
Tax benefits
Leverage (mortgage)
Mmmm
👉 Real outcome:
Real estate can yield 8–10% total in many cases
2. ⚡ The key factor: leverage
Here’s the big difference:
In the stock market: you usually invest 1:1
In real estate: you can use debt
Real example:
You put in $80k
You control a $400k asset
👉 If it goes up 5%:
Real profit ≈ 25% on your capital
👉 That's why:
Many wealthy prefer real estate
3. 📉 Risk and volatility (VERY different)
S&P 500:
It can drop -30% or -50% in a crisis
Housing:
Much more stable (but less liquid)
👉 Translation:
Stocks = more returns, more stress
Real estate = more stability, less growth
4. 💧 Liquidity (this changes everything)
Stocks: you sell in seconds
Property: it can take months
👉 This means:
The S&P is better for trading / flexibility
Real estate is better for disciplined long-term holding
5. 🧠 Chart bias (very important)
The chart you saw:
❌ Does not include:
Explicit dividends (although they are usually implied in S&P total return)
Rental income
Costs (maintenance, taxes, etc.)
👉 It's comparing:
“price vs price”
Not “investment vs complete real investment”
🔥 Real conclusion
👉 Yes:
The S&P 500 has been the best average passive wealth generator
👉 But:
Real estate can compete or even outperform if:
You use leverage
You generate rental income
You manage well
🧠 How you should think about this
It's not:
❌ “stocks vs real estate”
It's:
✅ how to combine them
Typical strategy:
60–80% stocks (growth)
20–40% real estate (stability + cashflow)