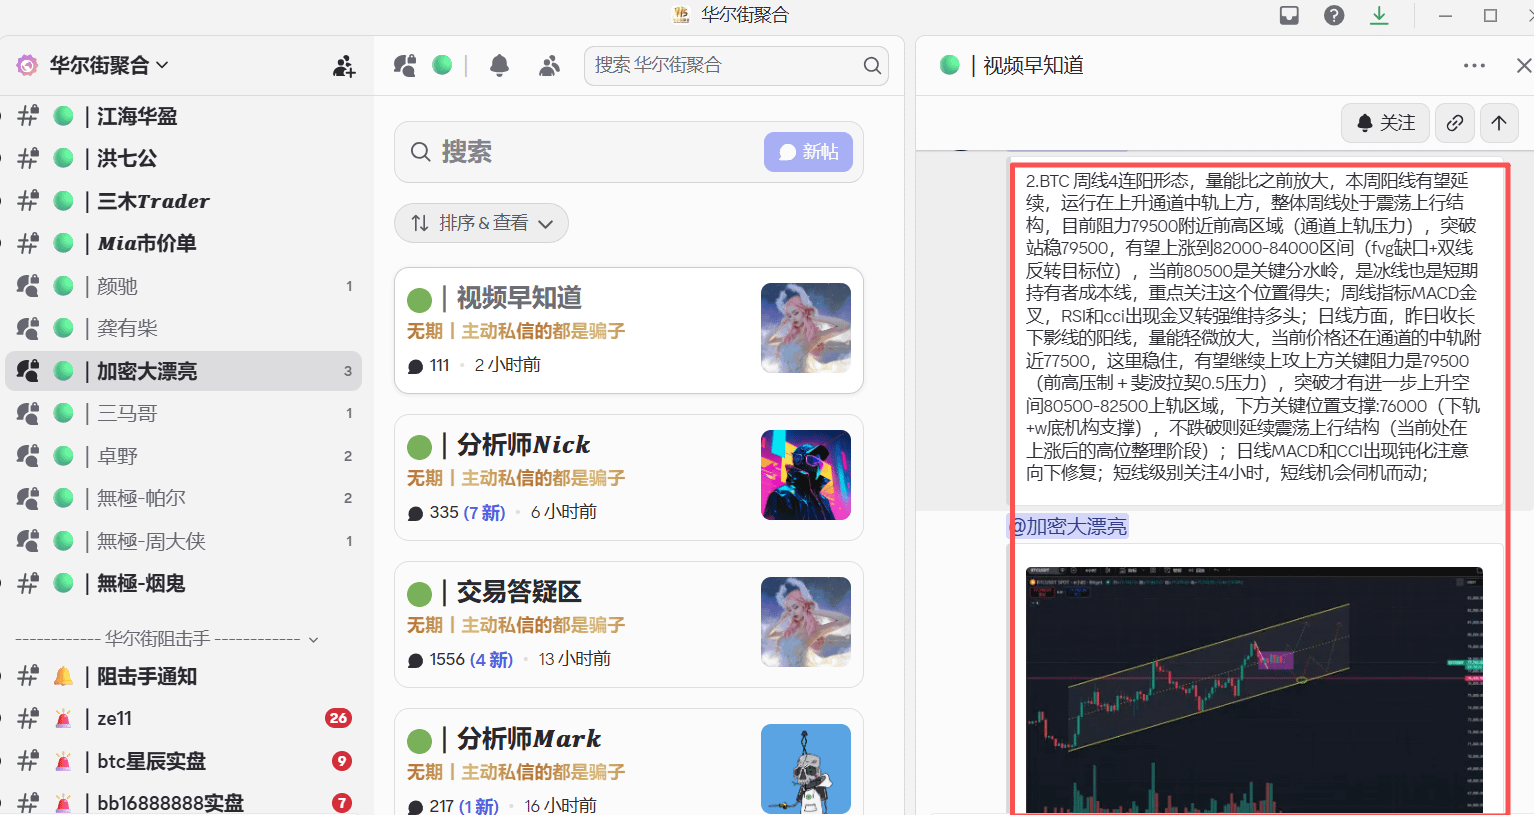
This weekend, Bitcoin's price action has undoubtedly given all the bulls a serious adrenaline shot. From the weekly candlestick chart, BTC has formed an extremely rare 'four consecutive green candles' pattern, and the volume is showing a healthy moderate increase. This isn't just a price uptick; it's a clear sign that market sentiment is shifting from doubt to conviction.
1. Space Calculation: Where's the target?
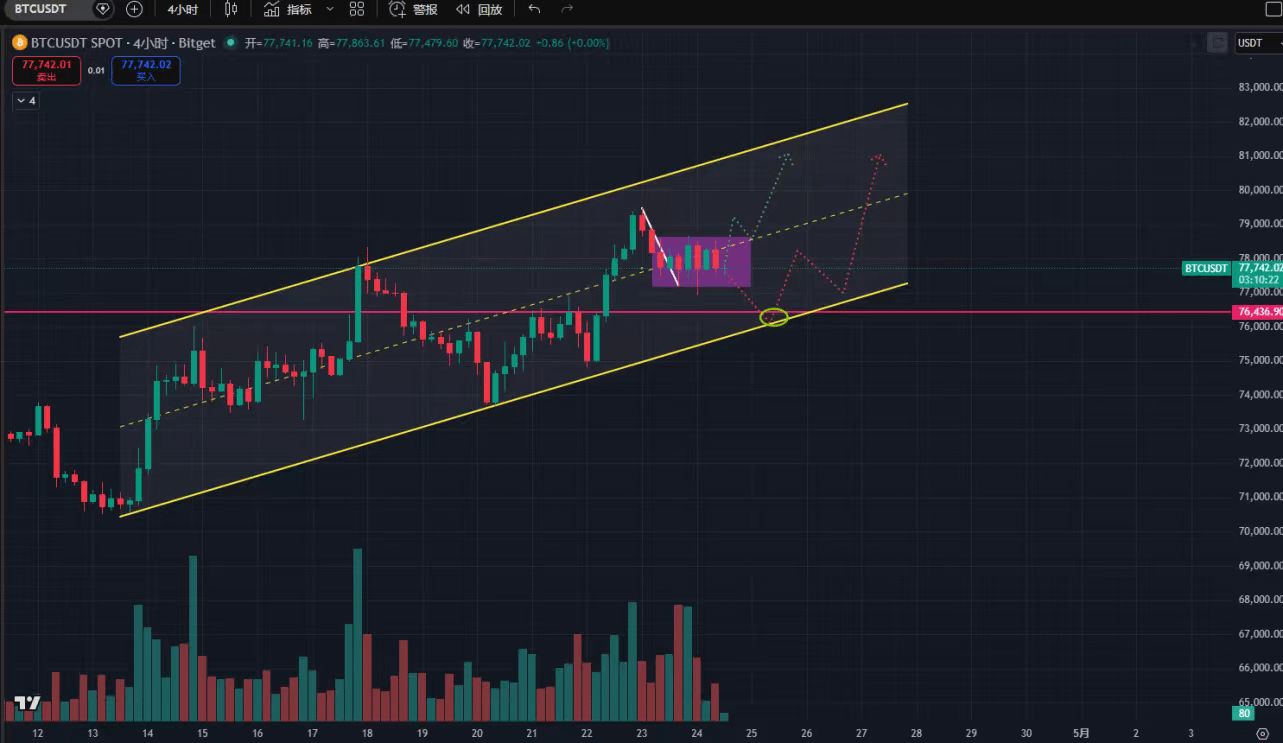
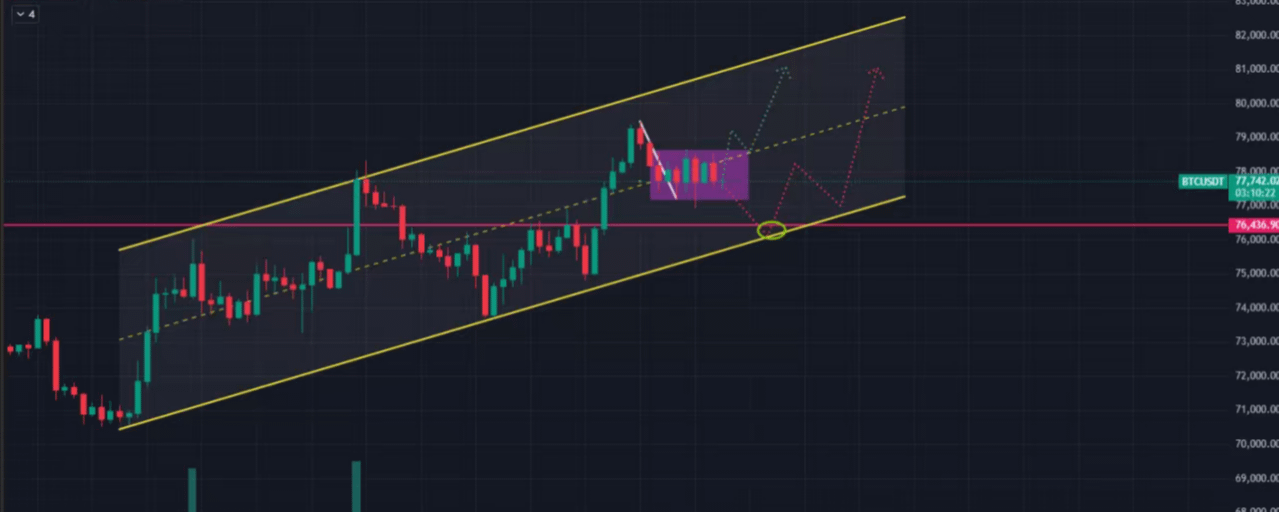
Currently, BTC is trading above the midline of an ascending channel. According to Big Beautiful's analysis, the key resistance level above is around $79,500. This level combines the upper channel resistance, previous highs, and multiple resistances at Fibonacci $0.5$. If we can effectively hold above $79,500$, the vacuum zone (FVG gap) above will push the price rapidly toward the $82,000 - $84,000 range.
2. Key support: The bulls' defense line
We need to keep an eye on the $77,500 'ice line'. It's not only the average cost line for short-term holders but also a psychological barrier for this bullish surge. As long as the price stays above it, the upward oscillation structure remains intact.
3. Summary
The market is currently in a high-level consolidation phase after the upward move. The MACD and RSI indicators are strong but showing signs of fatigue. It's advised for traders not to go short too easily, but also not to blindly chase highs near resistance levels; wait for structural confirmation to execute trend-following trades.