📊 Gold is showing signs of local fatigue after a significant rally. Let's break down what's happening on the 1D candlestick chart:
1️⃣ Price Action and Trend:
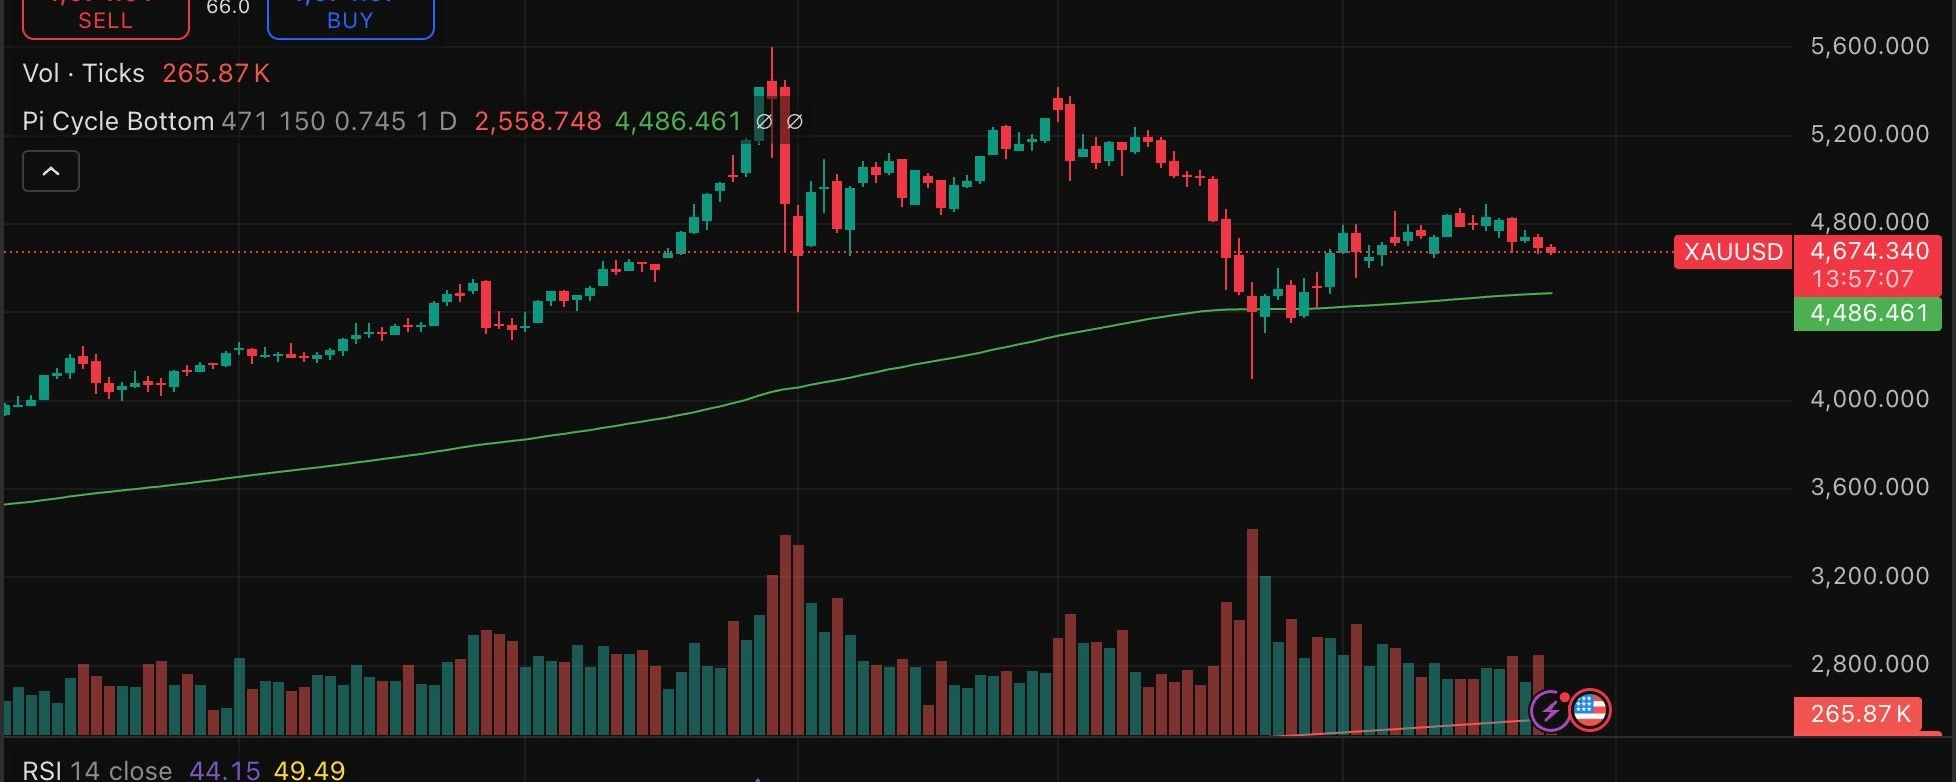
The price is in a correction phase after hitting a peak near the $5,400+ level. Currently, we're seeing consolidation around the $4,674 mark.
* Key point: The price has just tested dynamic support (the green moving average line), currently sitting at $4,486. As long as we stay above this line, the global bullish trend remains intact.
2️⃣ RSI (Relative Strength Index):
The RSI indicator is currently at 44.15.
* We've exited the overbought zone (where we were in February) and are now in a 'neutral-bearish' zone.
* The lack of a sharp rebound from the 40 level indicates that selling pressure is still noticeable.
3️⃣ Volumes and Indicators:
* Volume: We're seeing spikes in selling volumes during the recent local dips in March and April. This indicates profit-taking by large players.
* Pi Cycle Bottom: The indicator shows that the price has significantly diverged from the 'bottom' levels ($2,558), confirming market overheat in the long term.
📝 Summary and Scenarios:
🟢 Bullish: Holding above the $4,500 level and an RSI rebound above 50 could bring the price back to test resistance in the $4,800–$5,000 zone.
🔴 Bearish: A close below the green moving average ($4,486) will pave the way for a deeper correction in the $4,200–$4,000 range.
Signal: The market is currently in a wait-and-see mode. Entering a long position should only happen after confirmation of a bounce from support; shorting is advisable if there's a break below the trendline.
* Not financial advice! Always do your own research (DYOR).