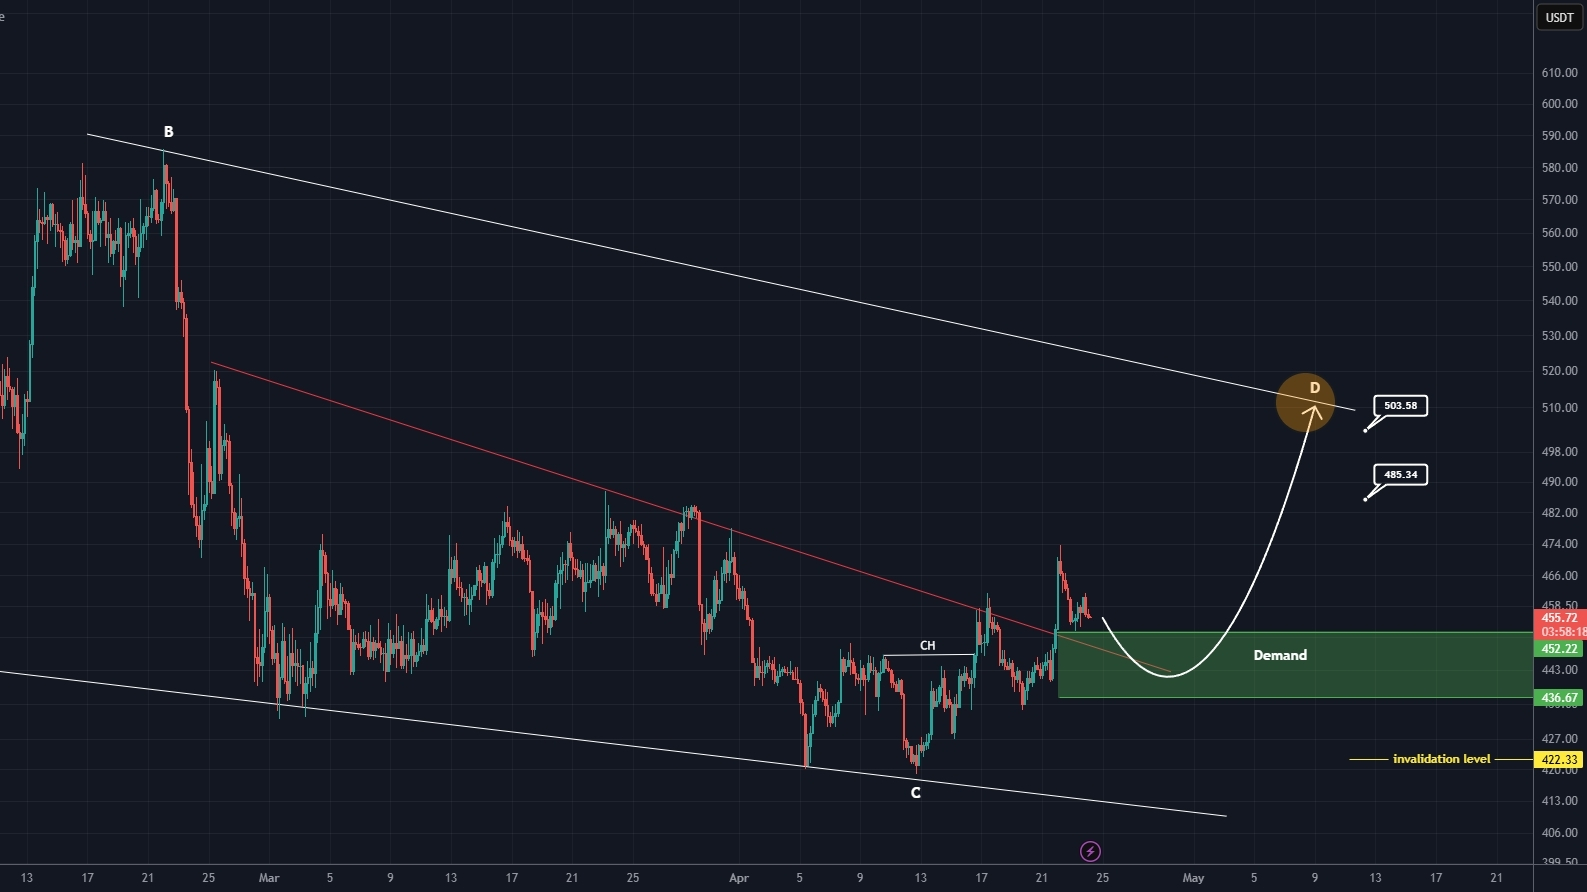

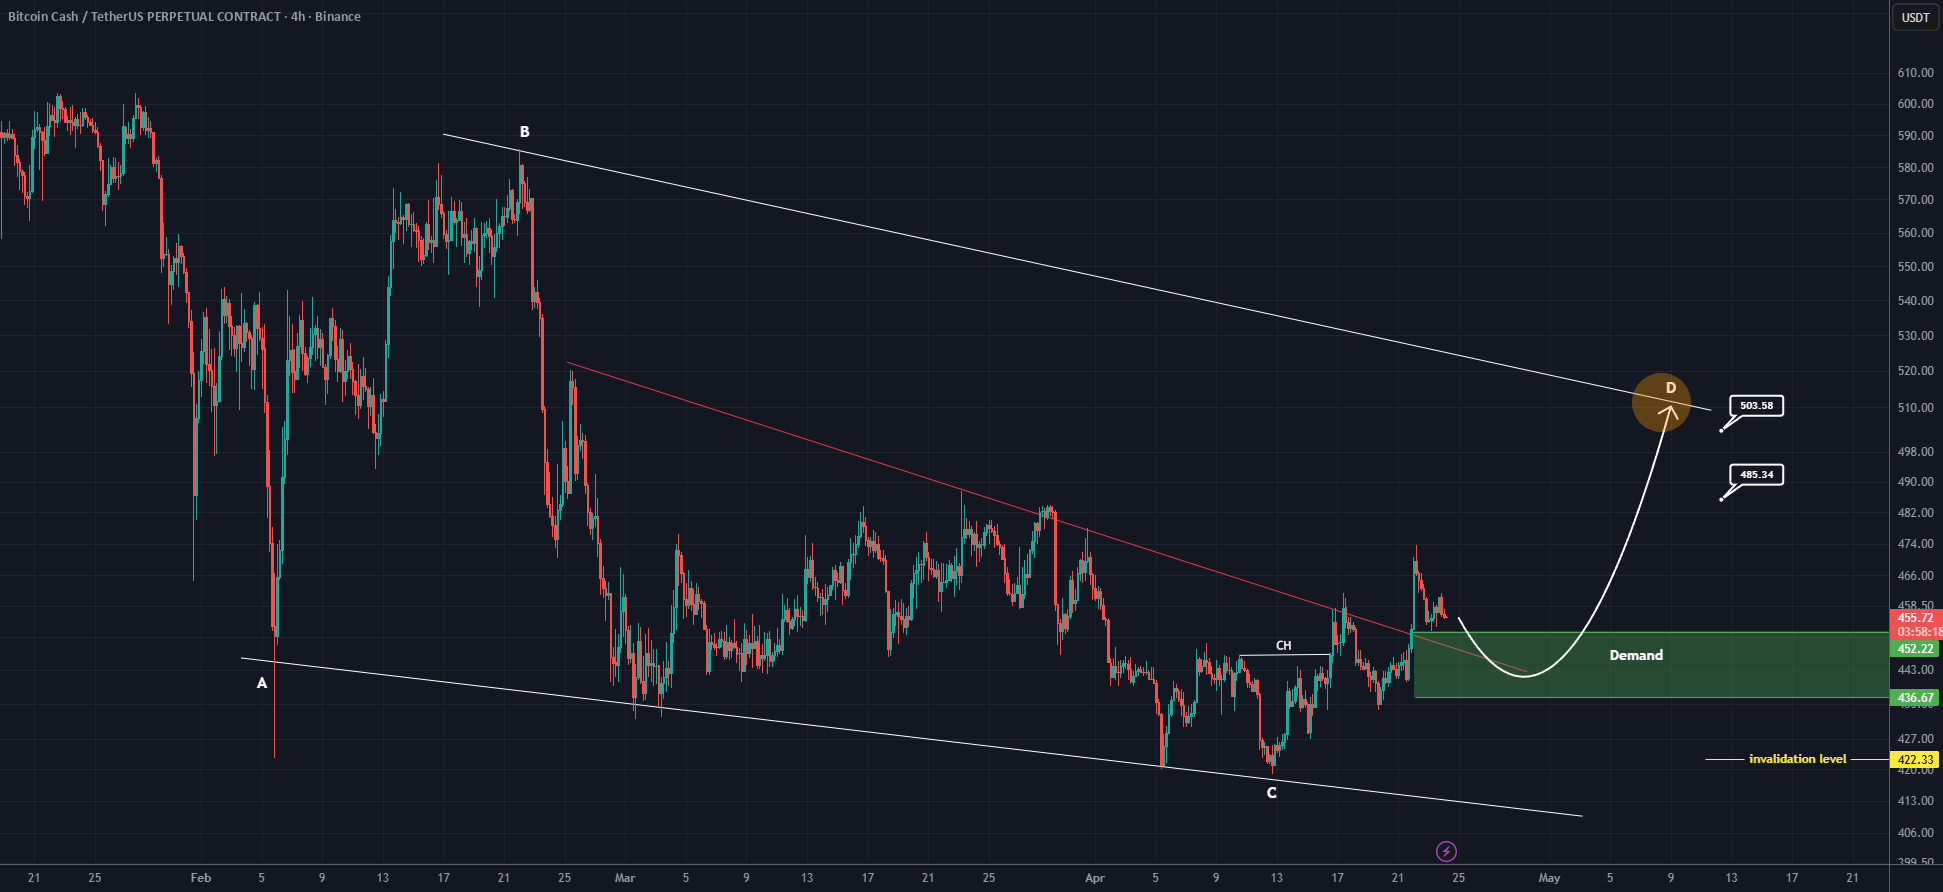
Bitcoin Cash appears to be forming a large triangle pattern on the higher timeframe and is currently developing within Wave C of this structure.
Within this Wave C, we can see that the red trendline previously acting as support has now been broken, indicating a shift in short-term momentum. However, this movement is still considered part of the corrective structure rather than a confirmed trend reversal.
As long as price remains inside the green zone, there is still a possibility for continuation within Wave C. This zone can be considered an area of interest for potential accumulation, where entries may be taken gradually using a DCA (Dollar Cost Averaging) approach rather than a single aggressive entry.
If price continues to respect this structure, the next phase would be the development of Wave D. For Wave D, we have defined two key targets on the chart. At the first target, it is recommended to secure partial profits, and then move the remaining position to breakeven to reduce risk while allowing potential continuation toward the second target.
However, it is important to stay cautious. A daily candle close below the invalidation level would completely invalidate this bullish corrective structure and the current wave interpretation would no longer be valid.
This is a structured scenario based on current price action and should be adjusted as the market evolves.
If you have a coin or altcoin you want analyzed, first hit the like button and then comment its name so I can review it for you.
