Based on the technical analysis of the 币安人生/USDT chart on the 1-day (1D) timeframe, here are the key points for entry and exit:
1. Entry Moment (Support Analysis)
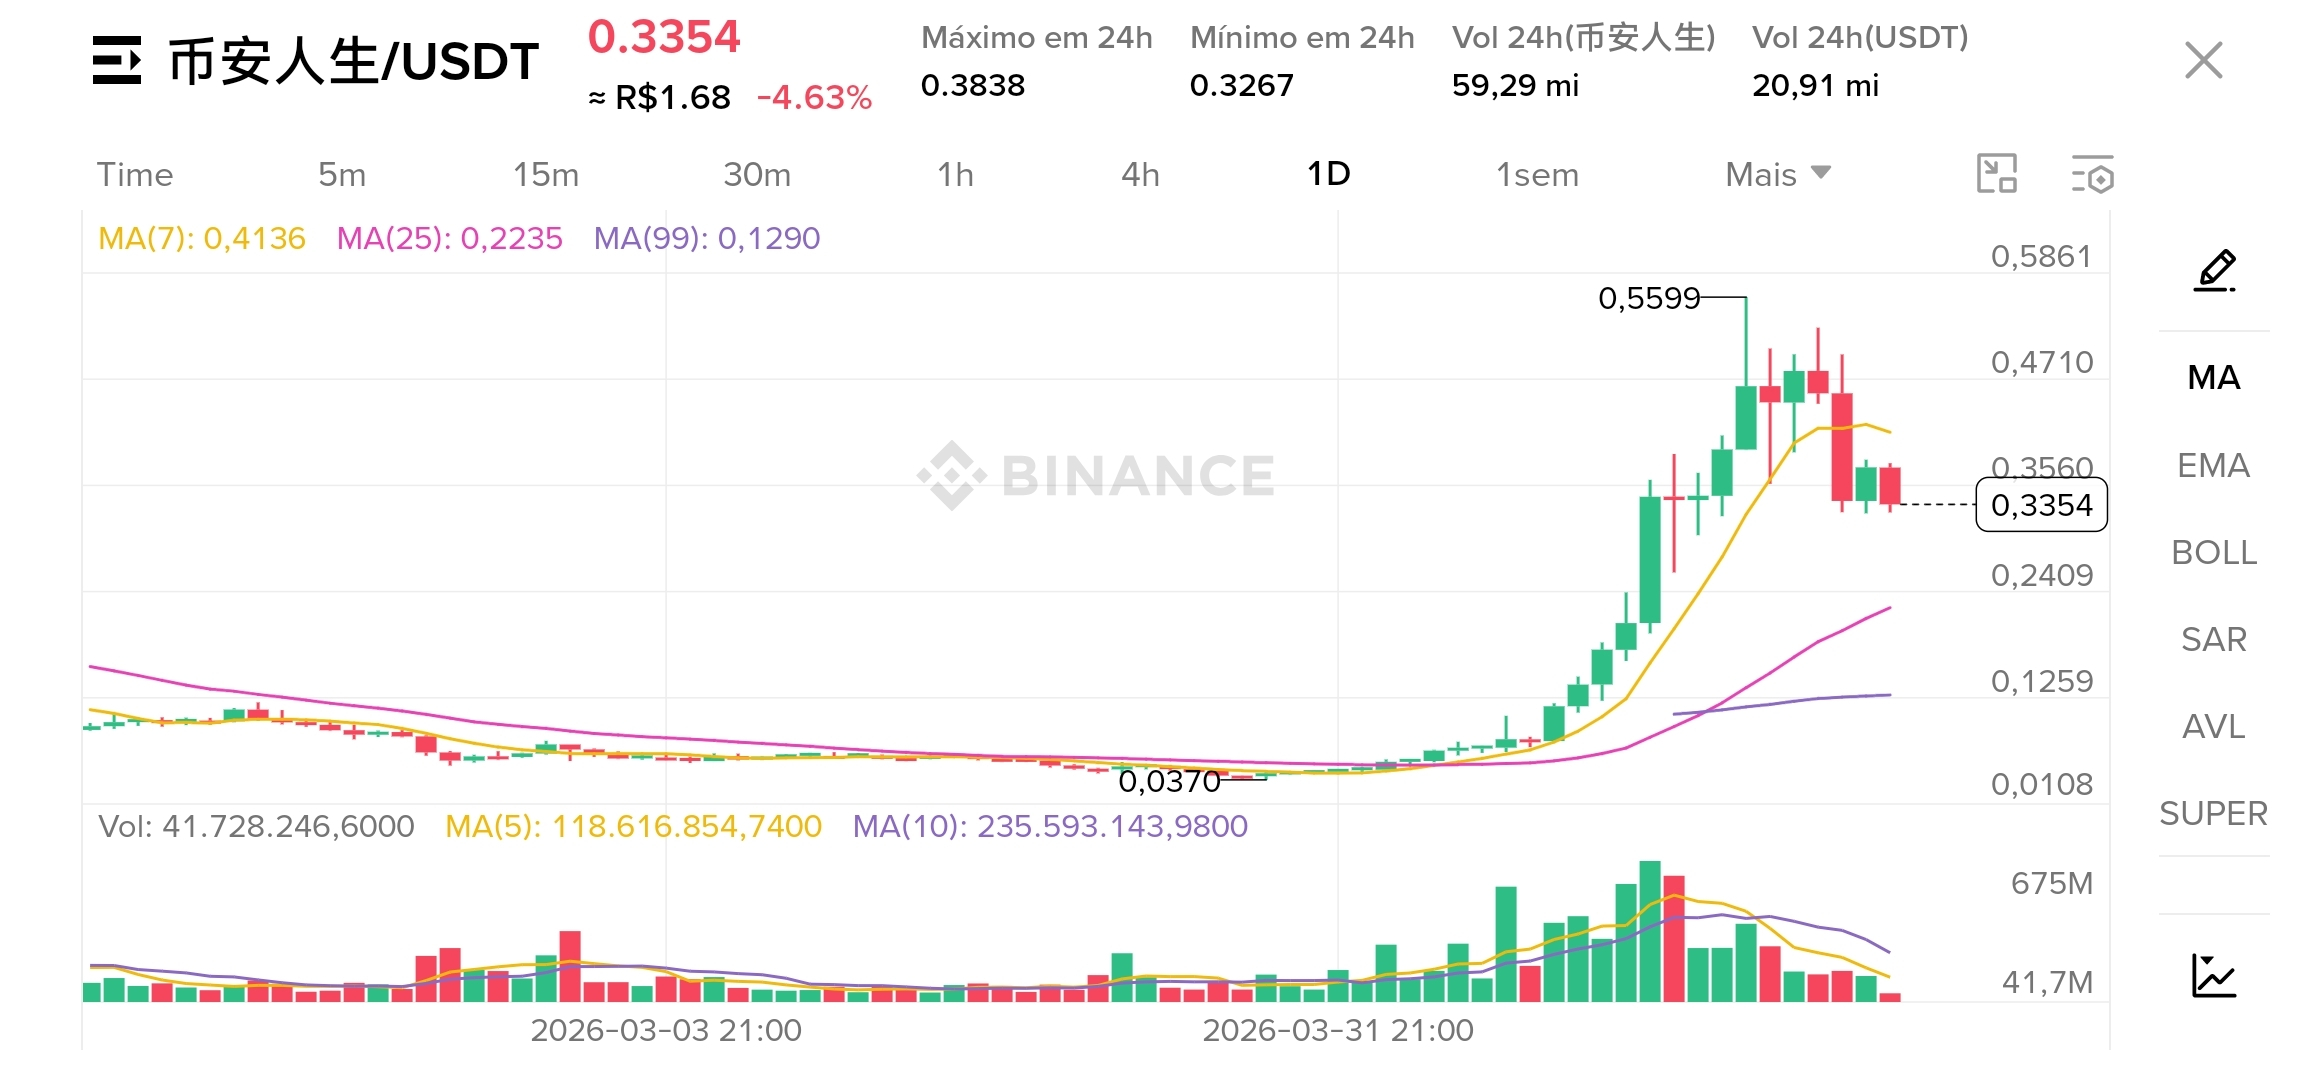
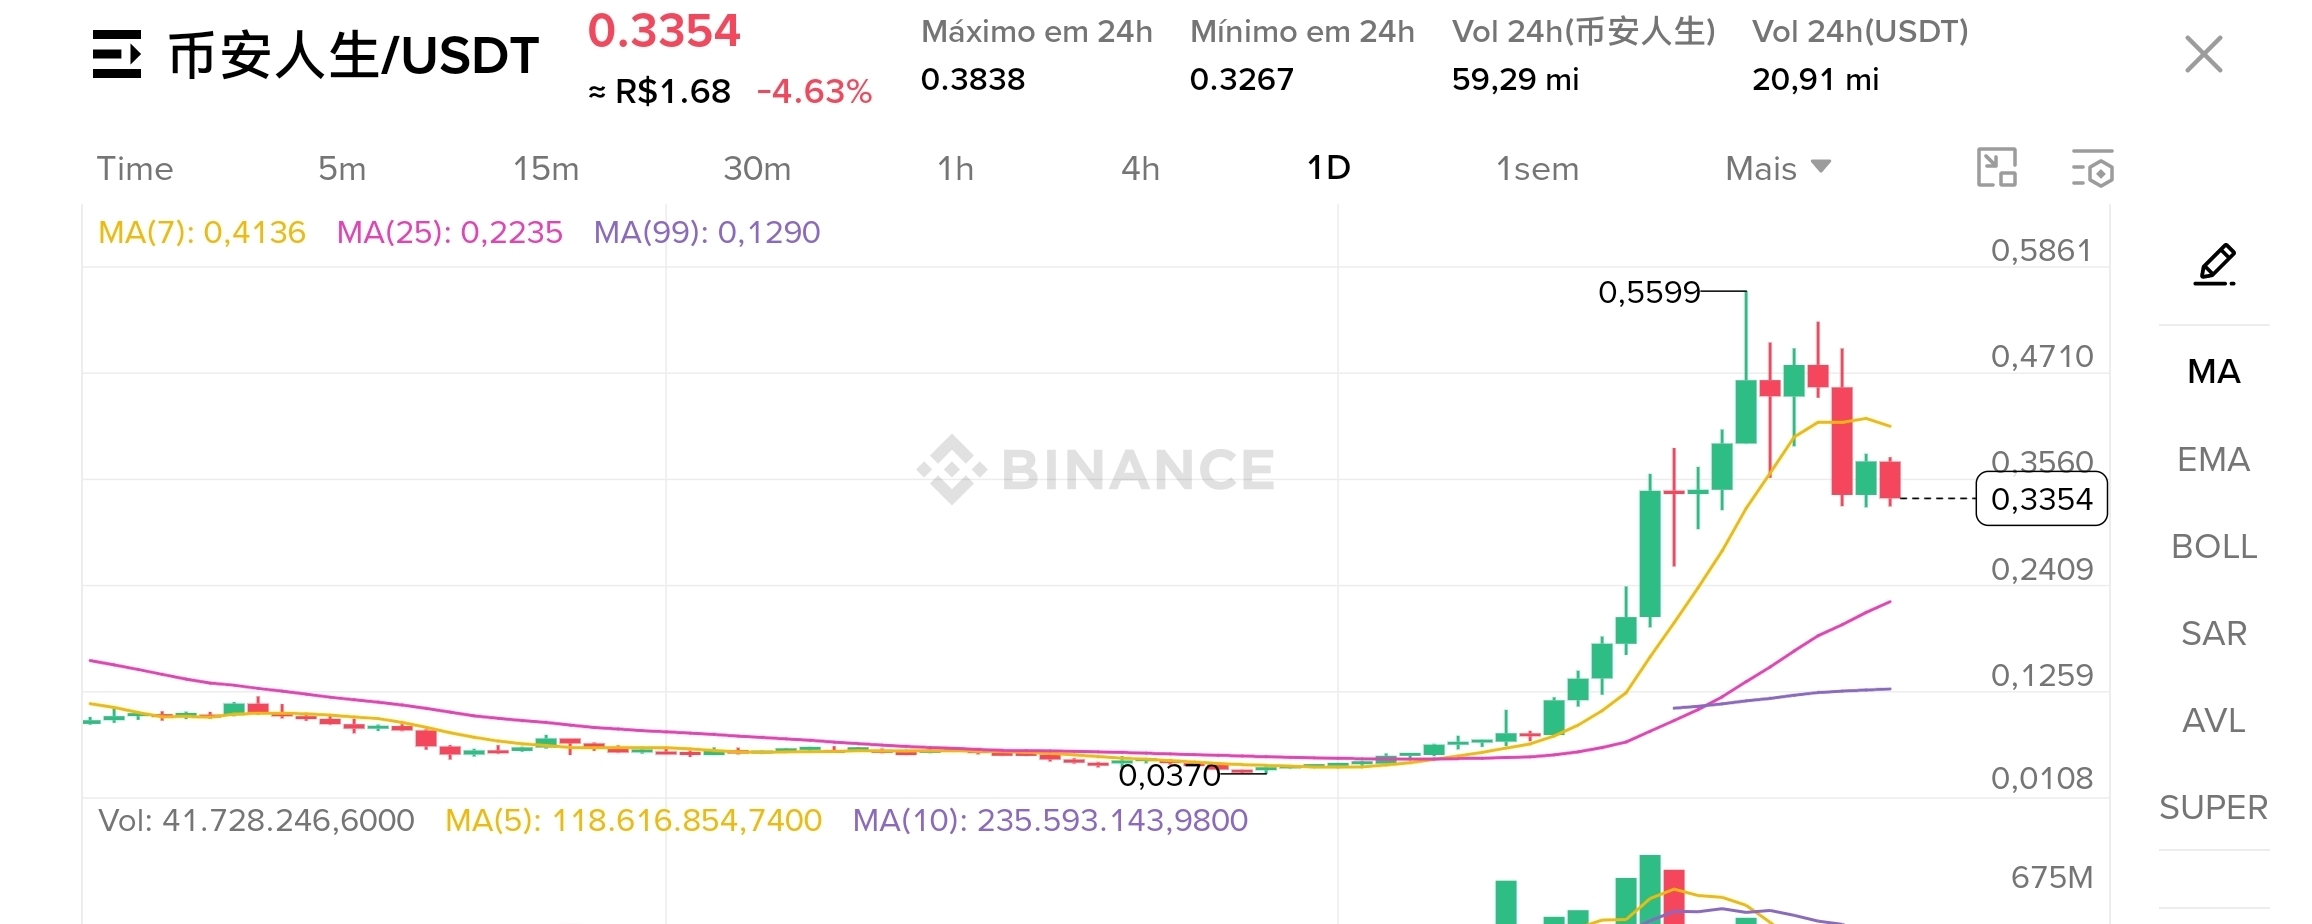
Past Entry: A clear entry opportunity occurred at the end of March 2026 when the asset broke out of the consolidation zone around 0.0370 and initiated a strong bullish move.
Potential New Entry: Currently, the price is in correction after hitting a peak of 0.5599. Technical traders typically look for new entries at support levels of moving averages:
MA(25): Located at 0.2235 (pink line), which could serve as a bounce point.
MA(99): Located at 0.1290 (purple line), representing a long-term support level.
A confirmation entry would also occur if the price closes above the MA(7) (0.4136) again with significant volume.
2. Exit Momentum (Resistance Analysis)
Recent Exit Signal: The asset peaked at 0.5599 and has started to drop. The current price of 0.3354 is now below the 7-day moving average (MA7 at 0.4136).
Interpretation: Being below the MA(7) is often interpreted as an exit signal or a "warning" for short-term traders, indicating that the immediate trend has lost momentum.
Exit Targets (Profit Taking): If there's a recovery, the area between the current quote and the previous high (0.5599) acts as a resistance zone for profit realization.
Current Indicators Summary
Current Price: 0.3354 (down 4.63%).
Volatility in the last 24h: High of 0.3838 and low of 0.3267.
Volume: There has been a decrease in trading volume compared to peak days, suggesting a period of exhaustion of the previous bullish trend.
Important Note: This analysis is based solely on the visual indicators of the chart (moving averages and price action) and does not constitute financial advice. Information outside of sources suggests that investment decisions should also consider fundamentals and risk management.
$币安人生 #BinanceLife/USDT $BTC $USDC #BinanceLaunchesGoldvs.BTCTradingCompetition #JustinSunSuesWorldLibertyFinancial #MarketRebound #StrategyBTCPurchase #WhatNextForUSIranConflict