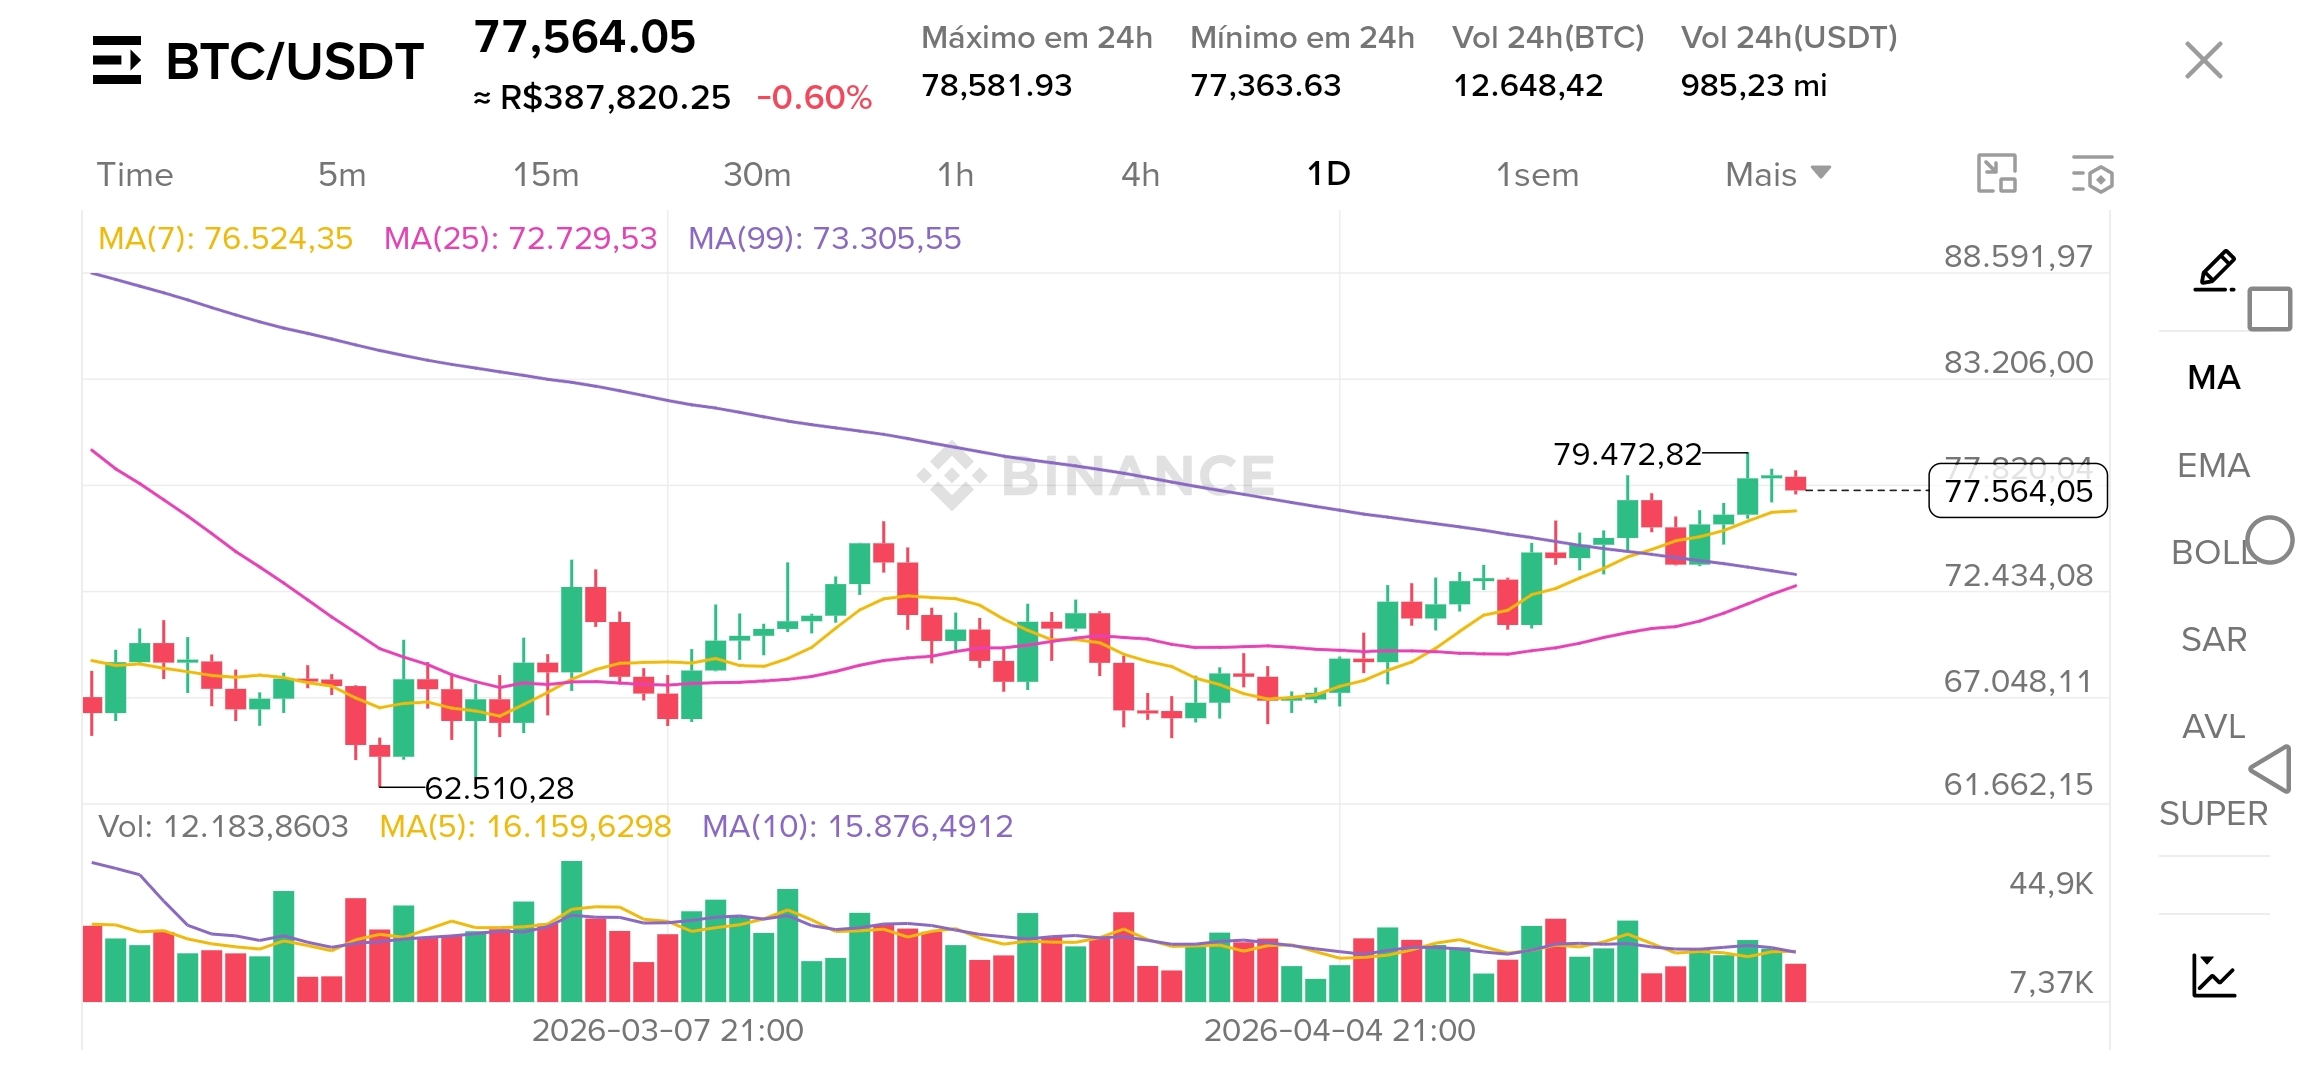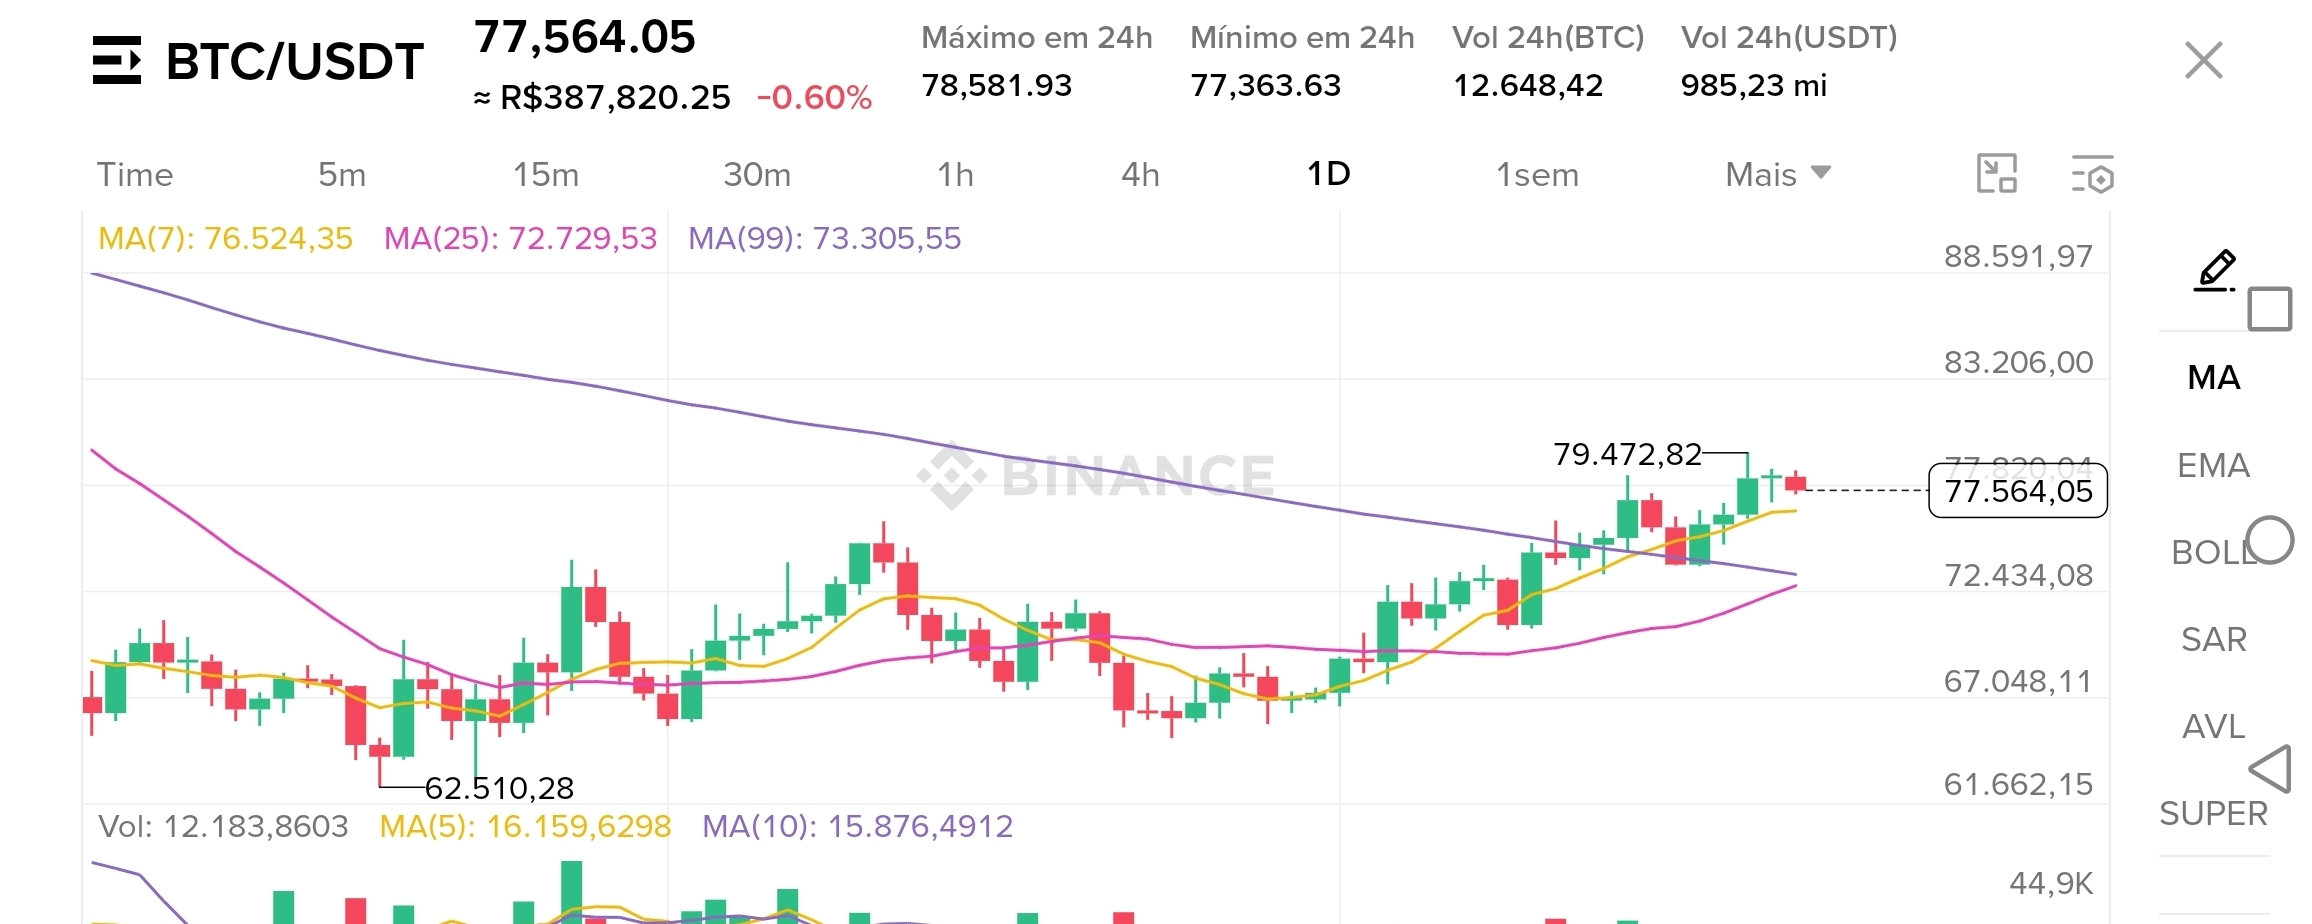
Bitcoin is sitting at a critical level of $77,564, testing technical resistance near $79,472. After a series of bullish moves that pushed the price above the 7, 25, and 99-day moving averages, the daily chart shows a momentary exhaustion of buying momentum, marked by a doji candle (small body) at the top.
Structure Analysis:
Even though the medium-term structure is bullish, with higher lows since $62,510, the outlook for the next 24 hours is neutral (consolidation). The price is range-bound between the prior top resistance and the immediate support of the 7-day moving average (MA7) at $76,524. Without a new influx of significant volume, the market is likely to "breathe" in this zone.
Operational Strategy:
Entry Point: Recommended only on a confirmed breakout above $79,600, ensuring that the supply at the top has been absorbed.
Take Profit (Exit): Targets in the $82,000 region, a zone of extension and psychological resistance.
Stop Loss: Set below $76,000, where a loss would invalidate the support at MA(7) and open up the possibility of targeting MA(25) at $72,729.
Verdict: Right now, there's no safe entry. The current risk/reward ratio is unfavorable for buying at the top. Patience to wait for a breakout or a retest of support is the most professional strategy at the moment.
#Bitcoin #TechnicalAnalysis #FinancialMarket #CryptoTrading $BTC $ETH $BNB #AaveAnnouncesDeFiUnitedReliefFund #OpenAILaunchesGPT-5.5 #BinanceLaunchesGoldvs.BTCTradingCompetition #CHIPPricePump #JustinSunSuesWorldLibertyFinancial