🎁🎁🎁🎁🎁
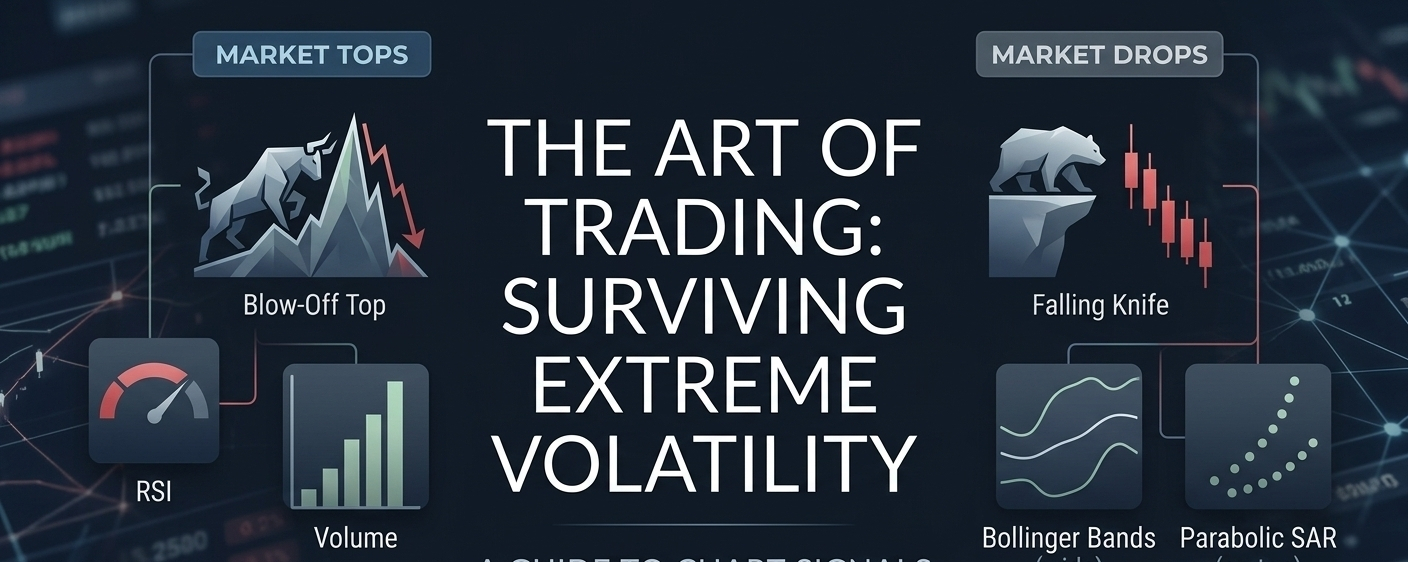
1. The "Blow-Off Top": When the Party Ends
A Blow-Off Top occurs after a long, steep rally. It is a chart pattern that indicates a massive surge in price and volume, followed by a rapid drop.
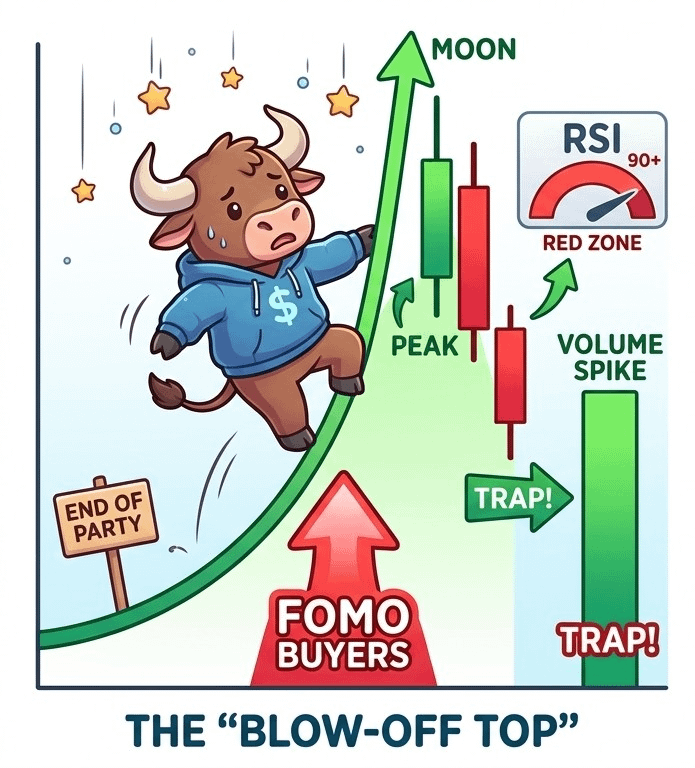
How it looks: The price moves almost vertically (parabolic). It looks like the coin will never stop going up.
The Trap: Retail traders see the +50% or +100% gains and buy in out of FOMO (Fear Of Missing Out).
The Reality: "Whales" and early investors are using that high retail buying volume to sell their large positions. Once the buying dries up, the price collapses because there is no "floor" supporting it.
Key Indicator: Look for a massive spike in Volume paired with a very high RSI (usually above 80 or 90). If the price hits a new high but the RSI starts to drop, that is a "Bearish Divergence."
2. The "Falling Knife": The Danger of Buying Dips
A Falling Knife is a slang term for a rapid drop in the price of an asset. The saying goes: "Don't try to catch a falling knife, or you'll get cut."
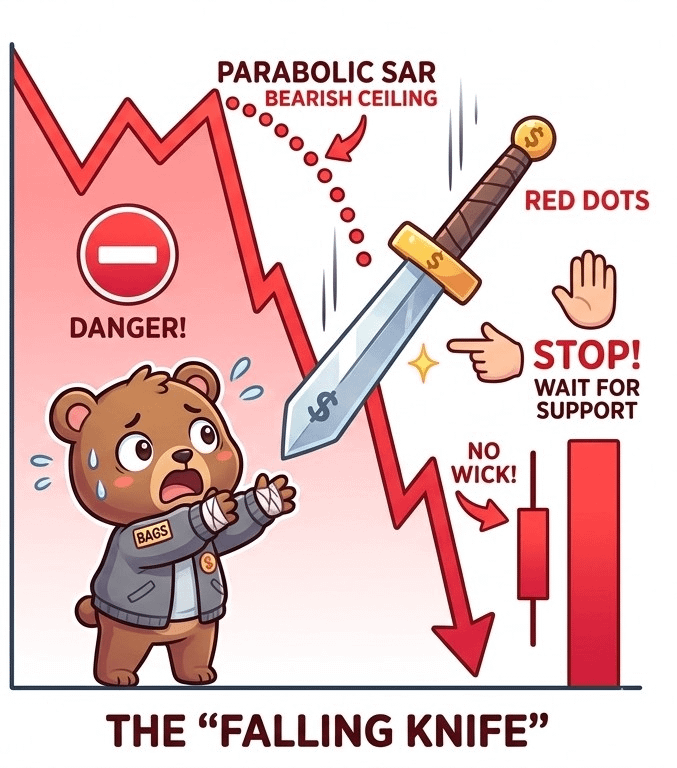
How it looks: A long, thick red candle (or a series of them) with very little "wick" at the bottom.
The Trap: Traders think, "It was $0.10 yesterday, now it's $0.07—it's cheap!" They buy in, only for the price to drop to $0.05.
The Reality: A falling knife usually happens due to bad news, a hack, or a major shift in market sentiment. The price hasn't found a "bottom" yet.
How to stay safe: Never buy a red candle while it is still moving down. Wait for the "handle" to form.
🛠️ How to Trade These Safely
To avoid getting hurt by these patterns, use your toolkit: Bollinger Bands, RSI, and Parabolic SAR among other indicators
Wait for the "Floor" (The SAR Flip)
If you see a falling knife, do not buy just because the RSI is low.
The Rule: Wait for the Parabolic SAR dots to flip from the top of the candles to the bottom. This confirms that the downward momentum has stopped and buyers are stepping back in.
Check the Bollinger Bands
In a Blow-Off Top: The price will be "walking" way outside the Upper Bollinger Band. Wait for a candle to close inside the bands before considering an exit.
In a Falling Knife: The price will be hugging the Lower Band. Wait for a candle to touch the 20 SMA and hold it as support before buying.
💡"Green candles represent the greed of others; Red candles represent their fear. Your job is to stay calm and wait for the indicators to confirm the truth."
Disclaimer: Not financial advice. DYOR & Always use a Stop-Loss!
