How to trade retracements like a pro using Fibonacci levels?
The "Fibonacci retracement" tool is one of the strongest tools for identifying entry and exit points, as it tells you where the "correction" might end before price resumes its original trend. Here’s a simplified explanation of the chart:
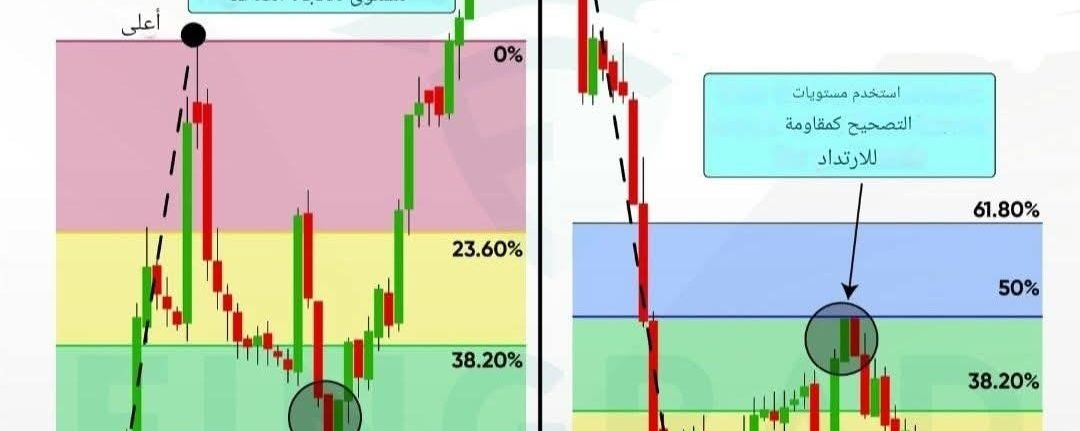
1️⃣ Bullish Retracement
In a bullish trend, we’re looking for a "buy" opportunity at the corrective bottom.
Method: We connect the Fibonacci tool from the lowest point (start of the move) to the highest point the price reached.
Target: Keep an eye on the levels (especially 38.2%, 50%, and 61.8%).
Outcome: We use these levels as "support." As shown in the chart, the price bounced from the 38.2% level to rise again and break the previous peak.
2️⃣ Bearish Retracement
In a downtrend, we look for a "short" opportunity at the corrective peak.
Method: Connect the tool from the highest point (start of the drop) to the lowest point the price reached.
Target: Watch for the price to return upward to test the retracement levels.
Outcome: We use these levels as "resistance." In this example, the price faced resistance at the 50% level and failed to break it, leading to a sharp drop.
Golden tips for success with this strategy:
Golden levels: The key levels traders watch are 50% and 61.8%.
Confirmation: Don’t enter just because the price touches the level; wait for a "reversal candlestick" (like price action) to confirm the retracement.
Trend is your friend: Always trade with the overall market direction, Fibonacci is your tool to ride the wave from the best possible point.
#Trading #Fibonacci #TechnicalAnalysis #Stocks #Cryptocurrencies #TradingTips" $XRP

