Market Analysis (1-Week Chart)
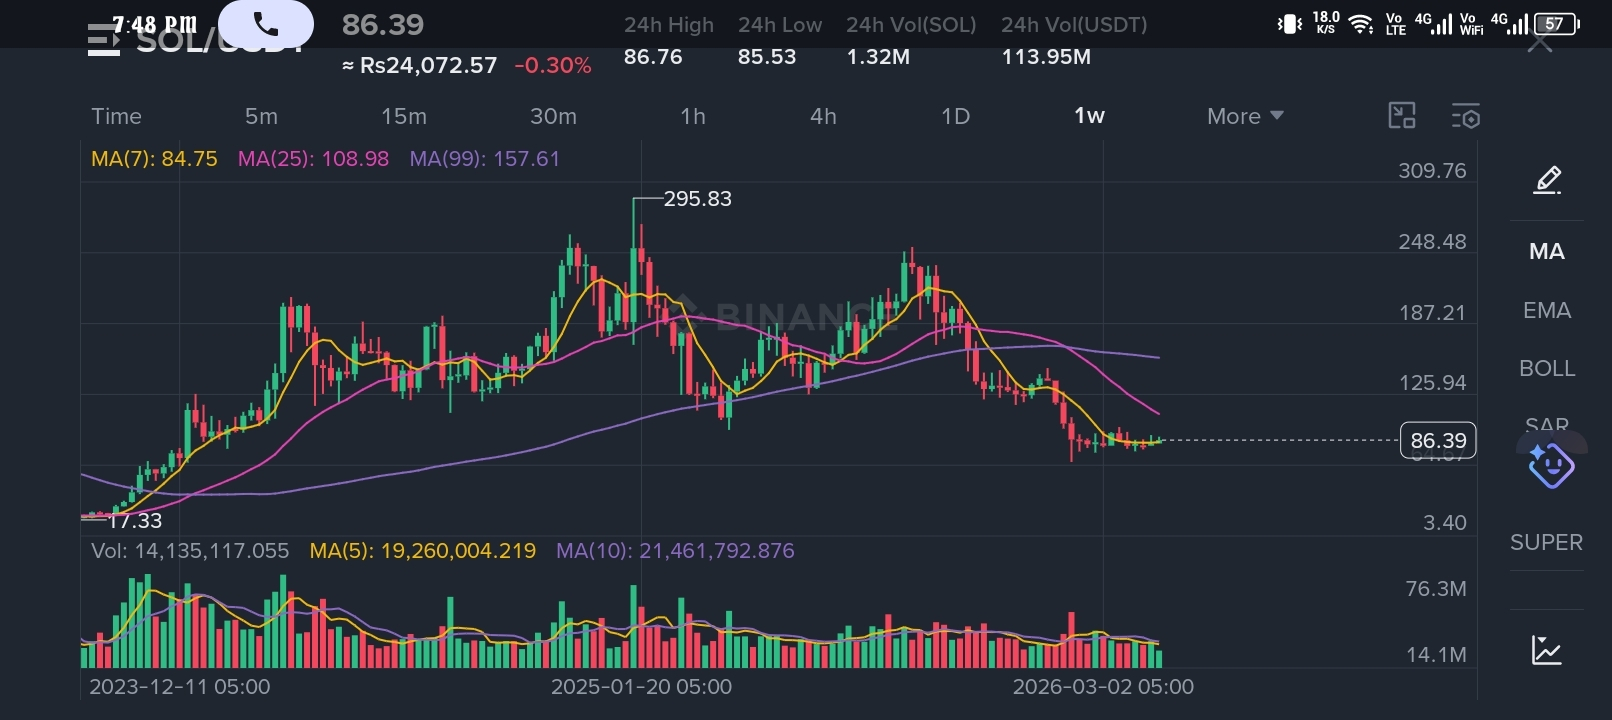
#Solana (SOL) is currently trading at a pivotal point on the weekly timeframe. After a significant correction from its local highs, the price is now hovering around the $86.39 mark.

Key Technical Observations:
Moving Averages (MA): The price is currently trading slightly above the 7-day Moving Average ($84.75), which is acting as immediate short-term support. However, it remains well below the 25-day MA ($108.98) and the 99-day MA ($157.61), indicating that the long-term trend is still bearish.
Support & Resistance: - Immediate Support: $84.00 - $85.00. If SOL manages to hold this level by the weekly close, we could see a relief rally.
Major Resistance: $109.00. Breaking this level is crucial for any bullish reversal.
Volume Action: The volume indicates a decrease in selling pressure, suggesting that the market is in a "wait-and-see" mode or a consolidation phase.
Price Prediction for Next Week:
Looking at the 1-week candle structure, SOL is showing signs of stabilization.
Bullish Scenario: If the current support at $84.75 holds firm through the week, there is a high probability of a minor bounce toward the $95 - $102 range as traders look to buy the dip.
Bearish Scenario: If the weekly candle closes below $84, we might see a further slide toward the $75 zone.
Conclusion:
For the next 7 days, Solana is likely to remain in a sideways to slightly bullish consolidation range ($85 to $98), provided Bitcoin remains stable. Traders should keep a close eye on the weekly close; holding above the MA(7) is the first step for a recovery.
Disclaimer: This analysis is for educational purposes only and does not constitute financial advice. Always do your own research (DYOR) before trading