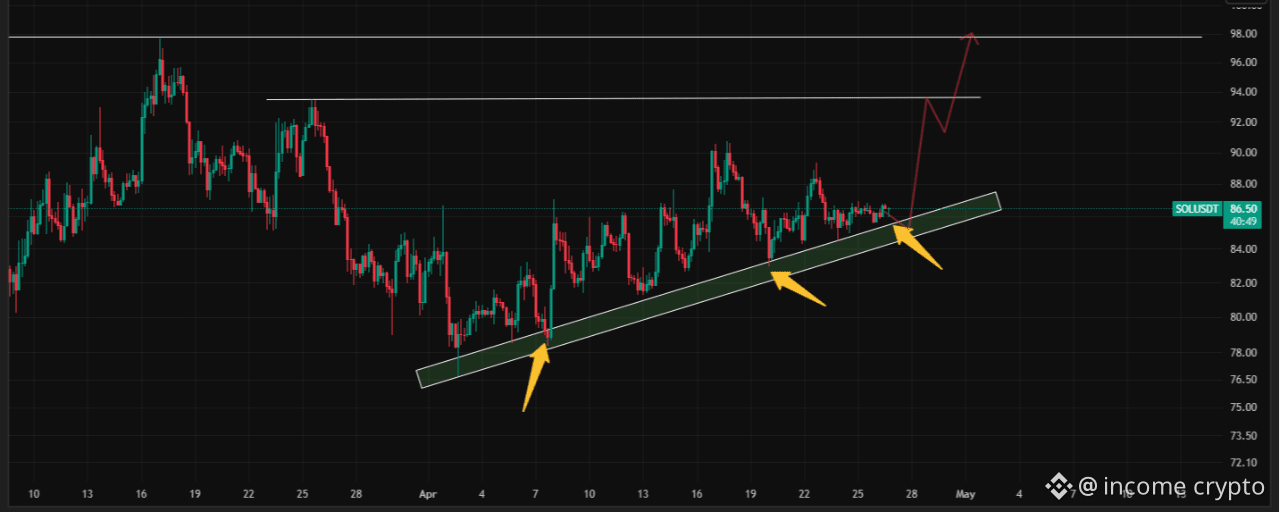
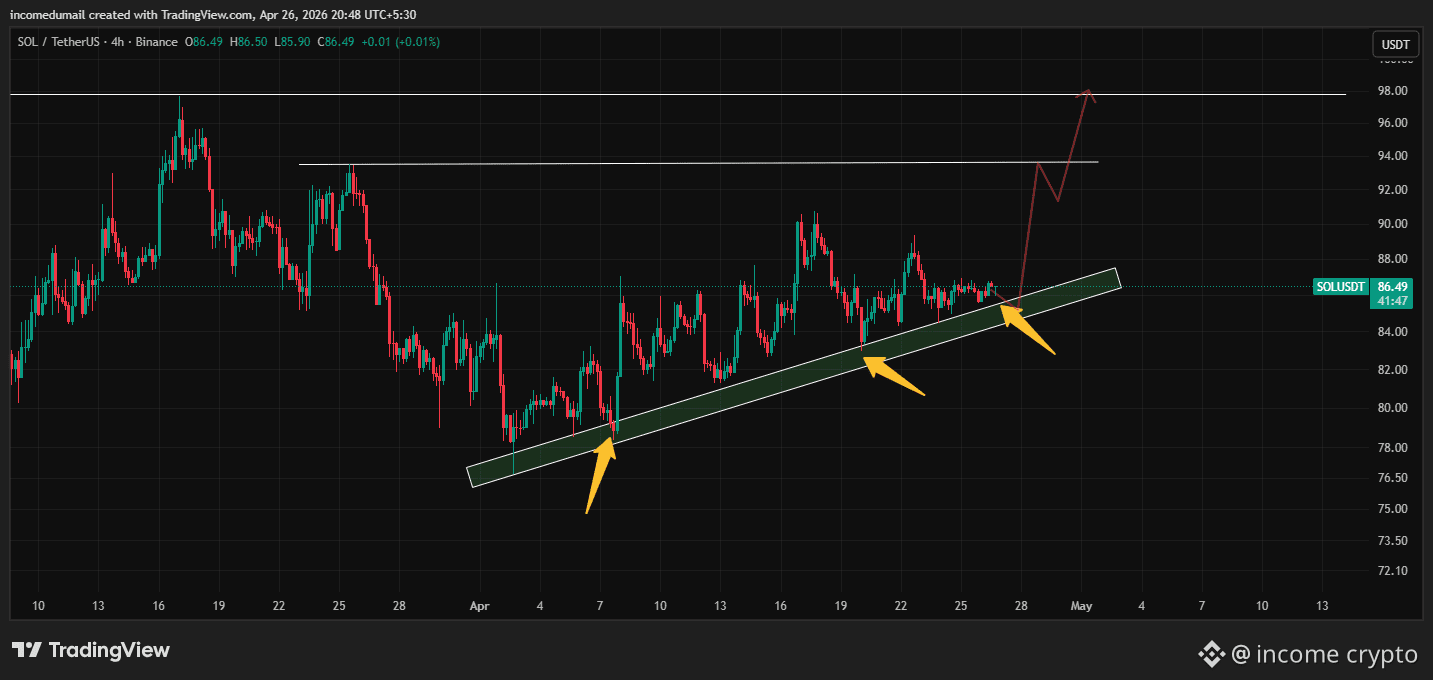
SOL is still holding one of the cleanest higher-low structures on the chart. That rising trendline has been respected multiple times, and price is now compressing just under short-term resistance while staying inside the broader bullish channel. That matters. It means buyers have not lost control yet, even though the move is slowing down a bit, because apparently markets enjoy pretending to be tired right before they expand.
The most important feature here is the repeated defense of the rising support zone. Every time price taps that trendline, buyers step back in. That tells you the market is not in distribution yet. It is still in a controlled uptrend, with momentum cooling rather than collapsing. As long as price keeps holding above the trendline area and continues to form higher lows, the structure favors continuation.
The next major decision point is the 93.5 to 94 zone, which is the first real resistance overhead. That level has already acted like a ceiling before, so if SOL pushes into it again, it becomes the key breakout trigger. A clean break and hold above that area opens the path toward 97 to 98, where the next liquidity pocket sits. That upper zone is where price would likely get tested hard, since markets love sweeping obvious highs with the enthusiasm of a tax auditor.
If the market rejects here instead, then the setup loses momentum and price likely rotates back toward the rising trendline around 83.5 to 84.5. That is the line in the sand. A failure there would not automatically kill the broader structure, but it would weaken the bullish continuation case and put SOL back into a deeper range.
Trade Frame
Bias: Bullish, but only if support keeps holding
Entry: 84.5 – 86.0 on pullback or breakout confirmation
Stop: 83.2
Targets:
T1: 90.0
T2: 93.5
T3: 97.0 to 98.0
Why this works
This is a classic trend-continuation structure. Rising support, higher lows, and a clear overhead resistance zone. The market is not showing panic selling, just consolidation near the upper end of the channel. That usually means one of two things: either continuation after a pause, or a rejection if buyers fail to reclaim resistance. Right now, continuation has the cleaner structure.
Risk
If SOL loses the trendline and closes below 83.2, the bullish thesis weakens fast. Then the chart stops looking like controlled expansion and starts looking like a failed attempt at breakout, which is how retail ends up holding bags and calling it conviction.
Bottom line
SOL is still bullish while the trendline holds.
Best case: reclaim 93.5 and run toward 97–98.
Worst case: lose 83.2, and the structure rolls over.
Right now the chart is saying: respect the trend, but don’t chase it blindly.

#EthereumFoundationUnstakes$48.9MillionWorthofETH #SolanaStrong #sol