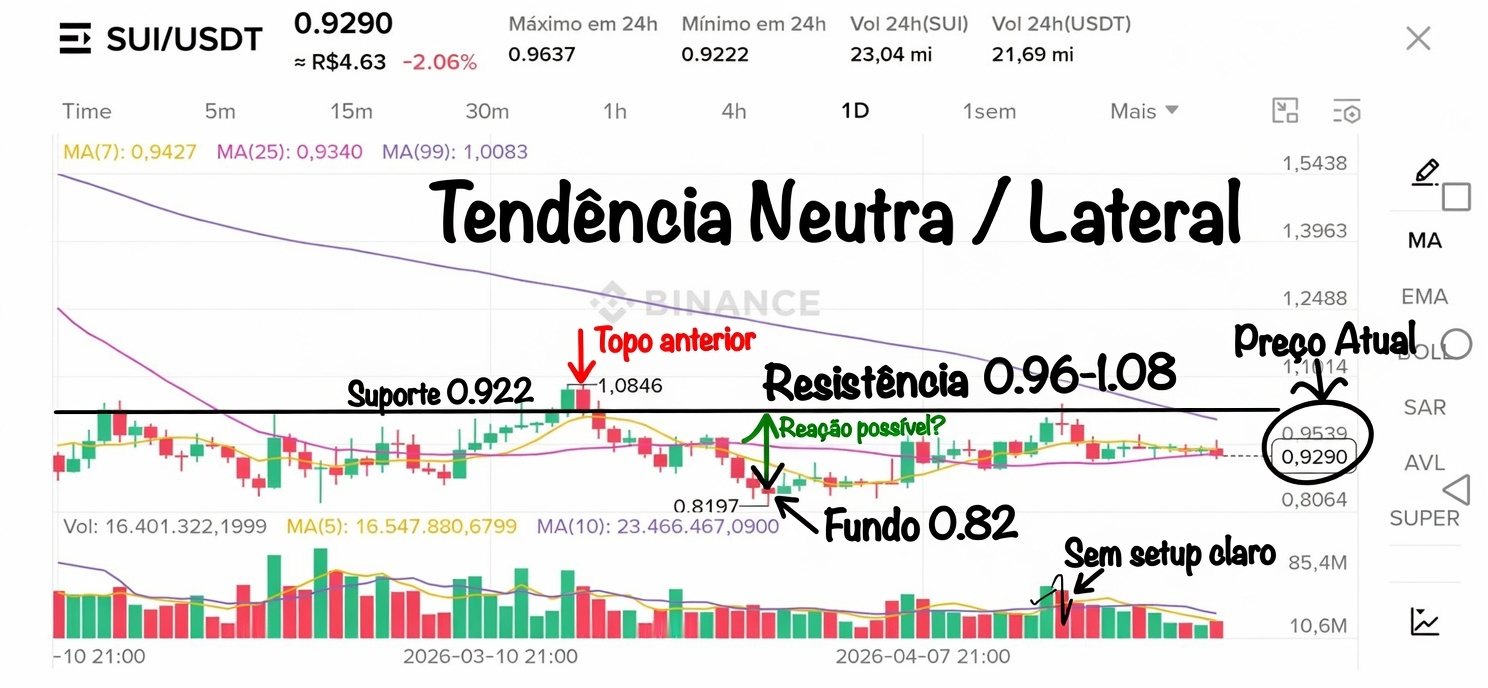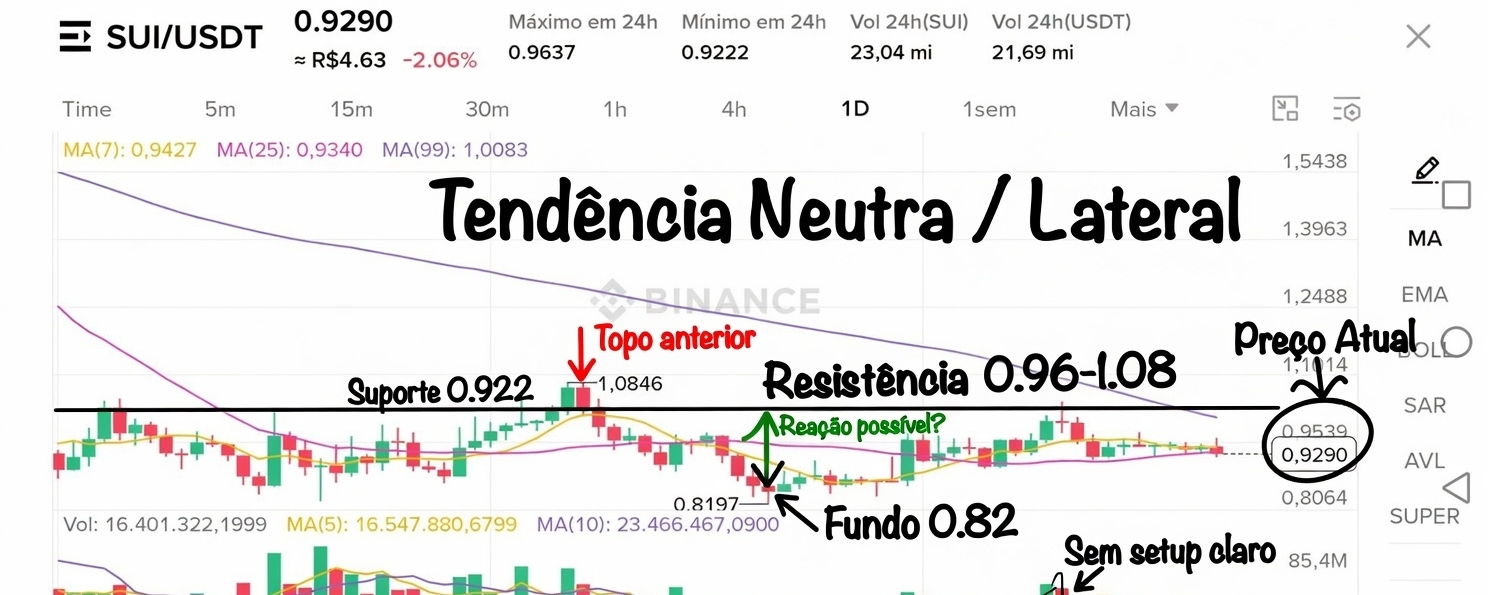
On the 1D chart for SUI/USDT, the price is at 0.9290 (-2.06% in 24h), oscillating between a low of 0.9222 and a high of 0.9637.
Market structure: after hitting a peak at 1.0846, the asset entered a correction/consolidation phase. The moving averages show MA(7) and MA(25) close to the current price (0.9427 and 0.9340), while the MA(99) remains above at 1.0083 — a signal of a possible transition or ranging. The volume doesn't show clear directional strength.
Current trend: neutral (indecision/ranging) between 0.92 and 0.96+, with no strong directional trend confirmed.
For the next 24 hours: neutral, with a slight recovery bias only if the support at 0.922 holds with buying volume.
There’s no safe entry point at the moment — the risk of continued sideways action or a false breakout is high. It’s recommended to wait for a clear break of resistance at 0.96 or a decisive reaction at support to define the trade.
Key support: 0.9222
Key resistance: 0.9637 / 1.0846
Patience remains the main strategy in this range.
What are you expecting from SUI in the next few hours?
#SUI #MarketRebound #StrategyBTCPurchase #WhatNextForUSIranConflict #RAVEWildMoves #KelpDAOFacesAttack#ARKInvestReducedPositionsinCircleandBullish #TechnicalAnalysis Crypto $SUI $BTC $XRP