
Key Highlights
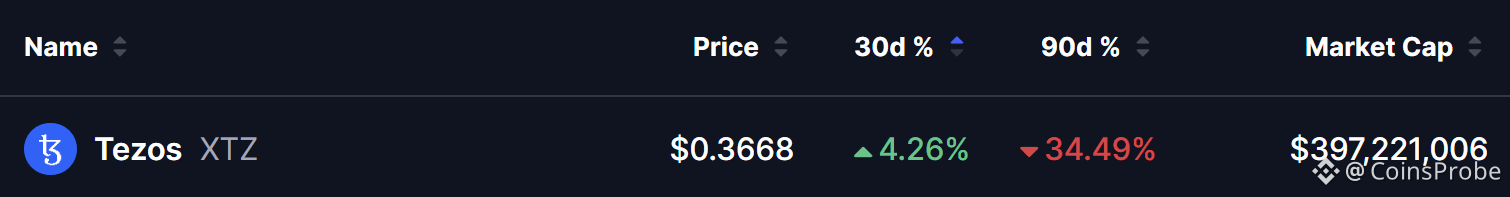
Tezos (XTZ) has shown resilience in the last 30 days, holding in the green after a continued drop over the past 90 days.
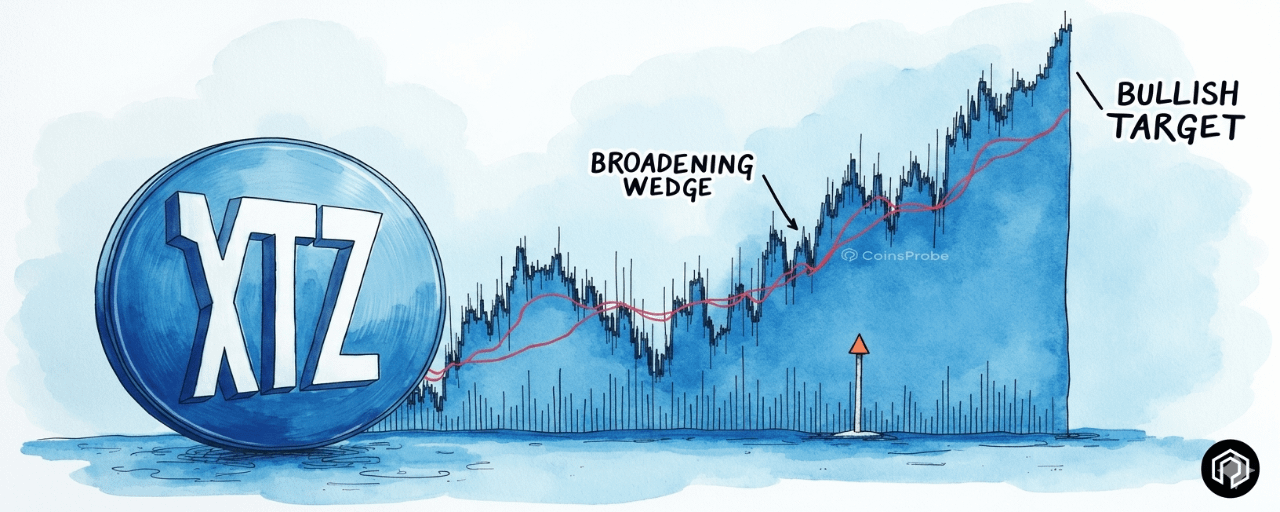
XTZ is forming an Expanding Broadening Bottom on the weekly chart — a structure that often precedes bullish reversals.
Price found support at the lower trendline near $0.3344 — a historically significant level where buyers have previously stepped in.
Each time XTZ reclaimed the 25 MA within this pattern, it triggered massive rallies of 105.74% and 162.83% respectively.
Bullish targets on a confirmed breakout: $0.6390 → $1.2200 → $2.4715
A weekly close below the lower support trendline would invalidate the bullish thesis entirely.
Tezos‘ native token XTZ — powering one of crypto’s longest-standing self-amending, energy-efficient Layer-1 blockchains — is beginning to flash early technical signals that the worst of its multi-year decline may be nearing an end. After absorbing an 82% drawdown from its late 2024 highs and enduring a relentless downtrend through much of 2025 and into early 2026, XTZ has recently shown a notable shift in behaviour — holding in the green over the last 30 days even as the broader 90-day picture still reflects a 34% loss. It is a subtle but important divergence that technical analysts are watching closely.
 Tezos (XTZ) Price/Source: Coinmarketcap
Meanwhile, the weekly chart is beginning to tell a clearer story — one that points toward a potential bullish reversal if key levels are reclaimed. The structure in focus: an Expanding Broadening Bottom, one of the more powerful — and often misread — reversal patterns in technical analysis.
Expanding Broadening Bottom — The Pattern in Focus
The weekly chart reveals an Expanding Broadening Bottom that has been developing since 2022 — a structure defined by higher peaks and lower troughs creating two diverging trendlines that expand over time. Unlike a standard falling wedge where trendlines converge, a broadening bottom sees volatility expand as the pattern matures — reflecting a market in transition between sellers losing control and buyers beginning to accumulate.
The key structural elements visible on the $XTZ weekly chart are:
Upper resistance trendline — connecting the successive rally highs of the pattern, sloping upward from the 2022-2023 base. This trendline capped XTZ’s most recent major rally near $1.9100 in late 2024, triggering the 82% decline that has brought price back to the lower boundary.
Lower support trendline — the critical floor of the entire pattern, where price most recently found support near $0.3344. This is the level buyers must defend for the bullish thesis to remain valid.
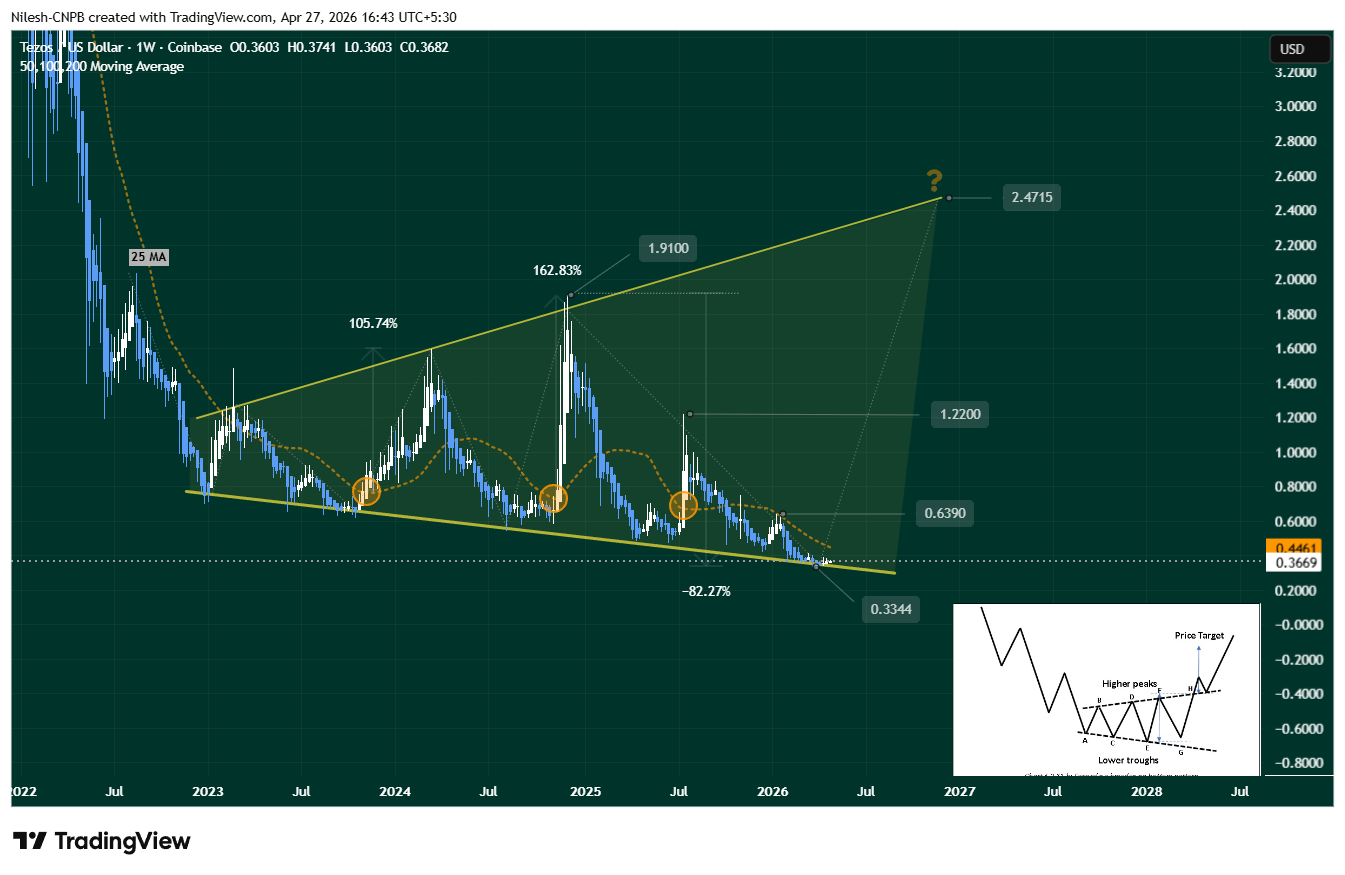 Chart: XTZUSD Weekly — Coinbase | Source: TradingView by Nilesh-CNPB, April 27, 2026
The 25 MA Signal — A Pattern Within the Pattern
One of the most compelling details on the XTZ weekly chart is the relationship between price and the 25-week moving average during each bounce from the lower trendline. The chart highlights a consistent and repeating signal: each time XTZ managed to reclaim the 25 MA after touching lower trendline support, it confirmed a shift in momentum and triggered a substantial rally toward the upper trendline.
The two most recent instances produced:
+105.74% rally from the lower trendline to the upper resistance zone
+162.83% rally from the subsequent touch of lower support to the next upper trendline peak near $1.9100
This recurring behaviour is not coincidental — it reflects the mechanical nature of broadening bottom patterns, where each successive bounce from support tends to carry further as buyers build conviction and sellers gradually exhaust their supply. The 25 MA reclaim serves as the confirmation trigger that separates a genuine bounce from a dead-cat reaction.
XTZ is currently trading at $0.3682 — still below the 25 MA — but the recent 30-day green performance suggests buyers are beginning to step in at the lower trendline zone for what could be the third confirmed bounce within this multi-year structure.
What’s Next for XTZ?
With the Expanding Broadening Bottom structure in place and early signs of buyer interest at the lower trendline, there are two clear scenarios traders are watching:
Bullish Scenario
If buyers manage to hold price above the lower support trendline and XTZ begins to build a base at current levels, the first confirmation signal to watch is a reclaim of the 50-week moving average at $0.4461. A sustained weekly close above this level would signal a genuine shift in momentum and open the door to the pattern’s progressive price targets:
First target: $0.6390 — the initial resistance zone within the broadening structure, representing a potential +73% move from current levels.
Second target: $1.2200 — aligning with the mid-upper zone of the pattern, a level that would mark XTZ’s first meaningful recovery into prior support-turned-resistance territory.
Full pattern target: $2.4715 — the complete measured move of the Expanding Broadening Bottom, representing a potential +571% from the $0.3344 swing low if the full bullish thesis plays out over the coming months into 2027.
Bearish Scenario
If buying pressure fails to materialise and XTZ cannot hold above the lower support trendline on a weekly closing basis, the bullish pattern thesis is invalidated. A weekly close below the lower trendline would signal that sellers remain in control and that the $0.3344 support was not a genuine accumulation zone — pushing XTZ toward further decline with no immediate structural support below. In this scenario the broadening bottom pattern would need to be reassessed entirely.
Bottom Line
Tezos (XTZ) is at one of the most technically significant junctures in its multi-year price history. The Expanding Broadening Bottom on the weekly chart — backed by two prior instances of 100%+ rallies from the same lower trendline — presents a compelling case that a meaningful bottom may be forming near $0.3344. The 30-day green performance amid broader 90-day weakness adds a layer of fundamental resilience to the technical setup.
The path forward is clear: a reclaim of the 50-week MA at $0.4461 is the line in the sand. Above it, the pattern’s bullish targets of $0.6390, $1.22, and ultimately $2.4715 come into focus. Below the lower trendline on a weekly close — the thesis is off the table.
Disclaimer: The views and analysis presented in this article are for informational purposes only and reflect the author’s perspective, not financial advice. Technical patterns and indicators discussed are subject to market volatility and may or may not yield the anticipated results. Investors are advised to exercise caution, conduct independent research, and make decisions aligned with their individual risk tolerance.