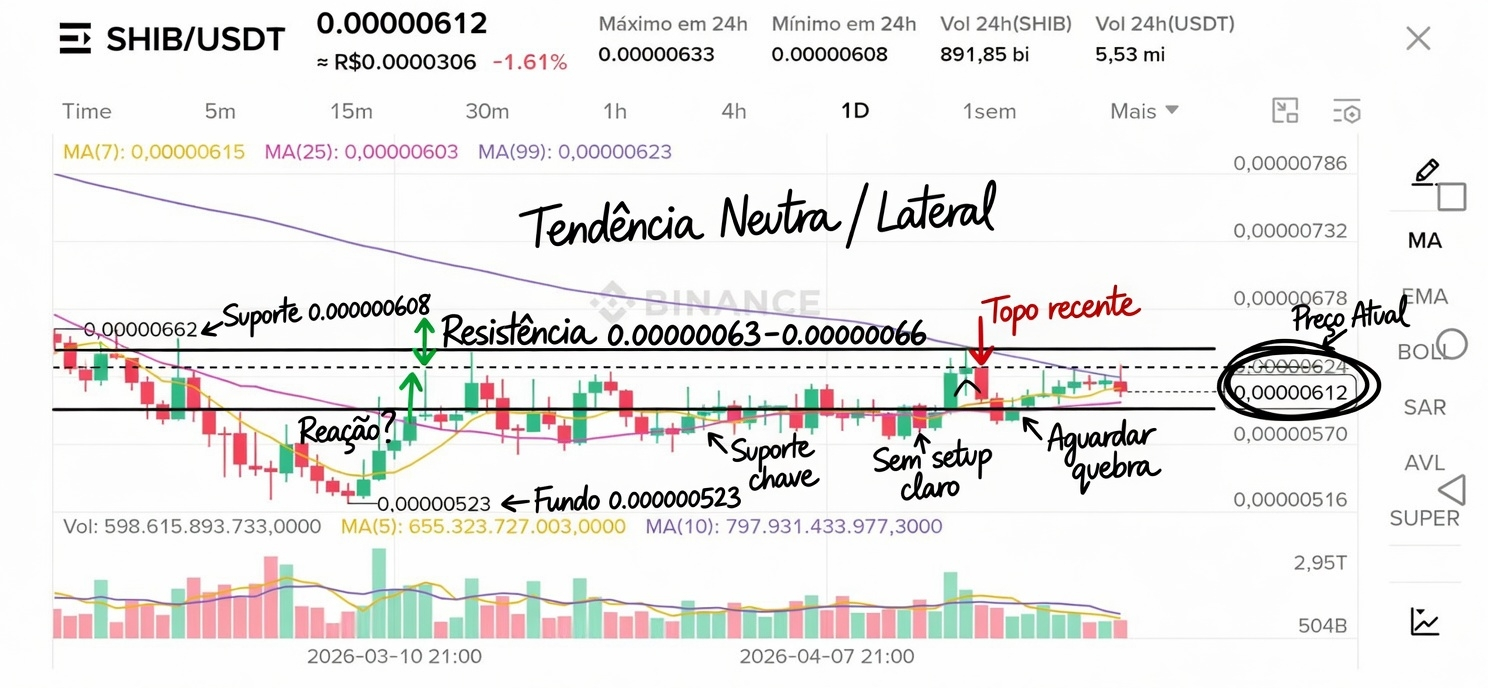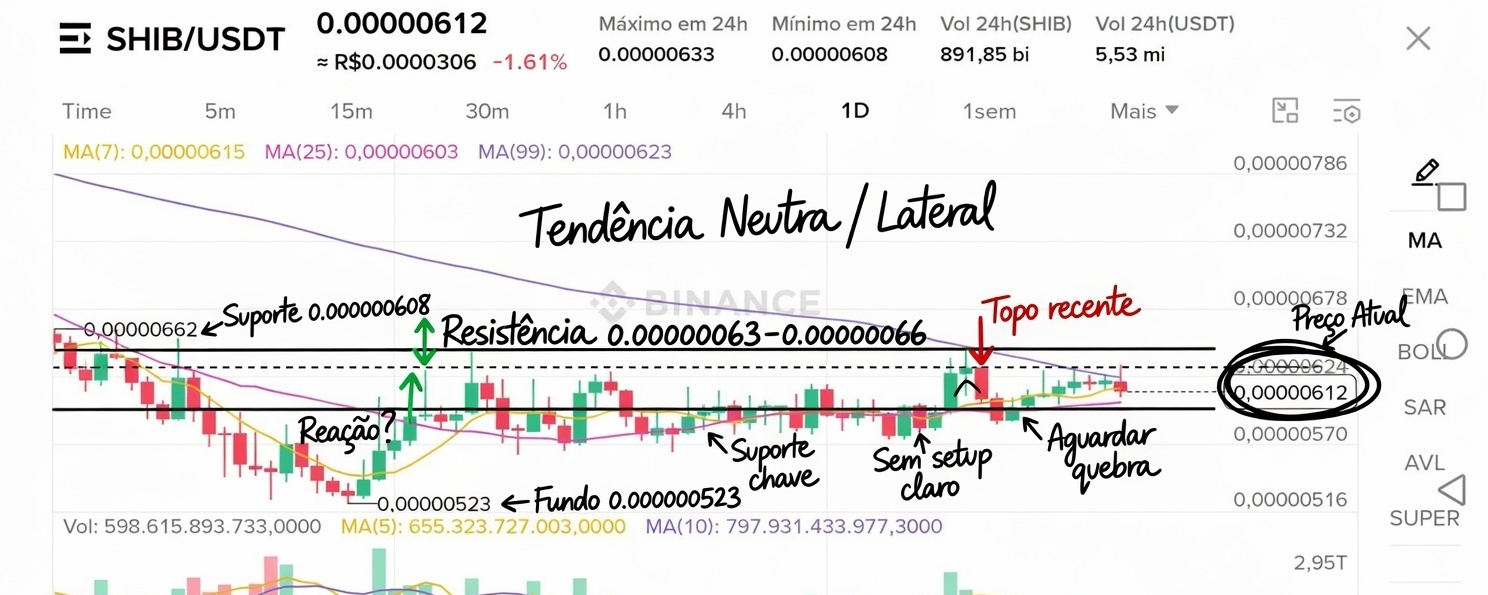
On the 1D chart of SHIB/USDT, the price is at 0.000000612 (-1.61% in the last 24h), ranging between a low of 0.000000608 and a high of 0.000000633.
Market structure: after hitting a bottom at 0.000000523, the asset has been forming a tight consolidation around the 0.00000060 region. The moving averages are very close (MA(7) 0.000000615, MA(25) 0.000000603, MA(99) 0.000000623), indicating low volatility and lack of a strong directional trend. Volume shows isolated spikes without clear confirmation of accumulation or distribution.
Current trend: neutral (indecision/consolidation) in a very tight range.
For the next 24h: neutral, with a slight bullish reaction possible only if the support at 0.000000608 holds.
There’s no safe entry point at the moment — the range is too tight to provide a good risk/reward. It’s advisable to wait for a clear break of resistance at 0.000000633 or a decisive move outside the current range.
Key support: 0.000000608
Key resistance: 0.000000633 / 0.000000662
In memecoins like SHIB, patience and volume confirmation are crucial during this phase of low volatility.
What do you expect from SHIB in the short term?
#SHIB #ShibaInu #TechnicalAnalysis $SHIB $BTC $ETH #SoldierChargedWithInsiderTradingonPolymarket #BalancerAttackerResurfacesAfter5Months #CanTheDeFiIndustryRecoverQuicklyFromAaveExploit? #ShootingIncidentAtWhiteHouseCorrespondentsDinner #MarketRebound