Today, we are diving into the CHIP/USDT monthly chart, which is showing some highly volatile and interesting price action on Binance. If you’re tracking this pair, here is a breakdown of what the data suggests.
Current Market Status 📊
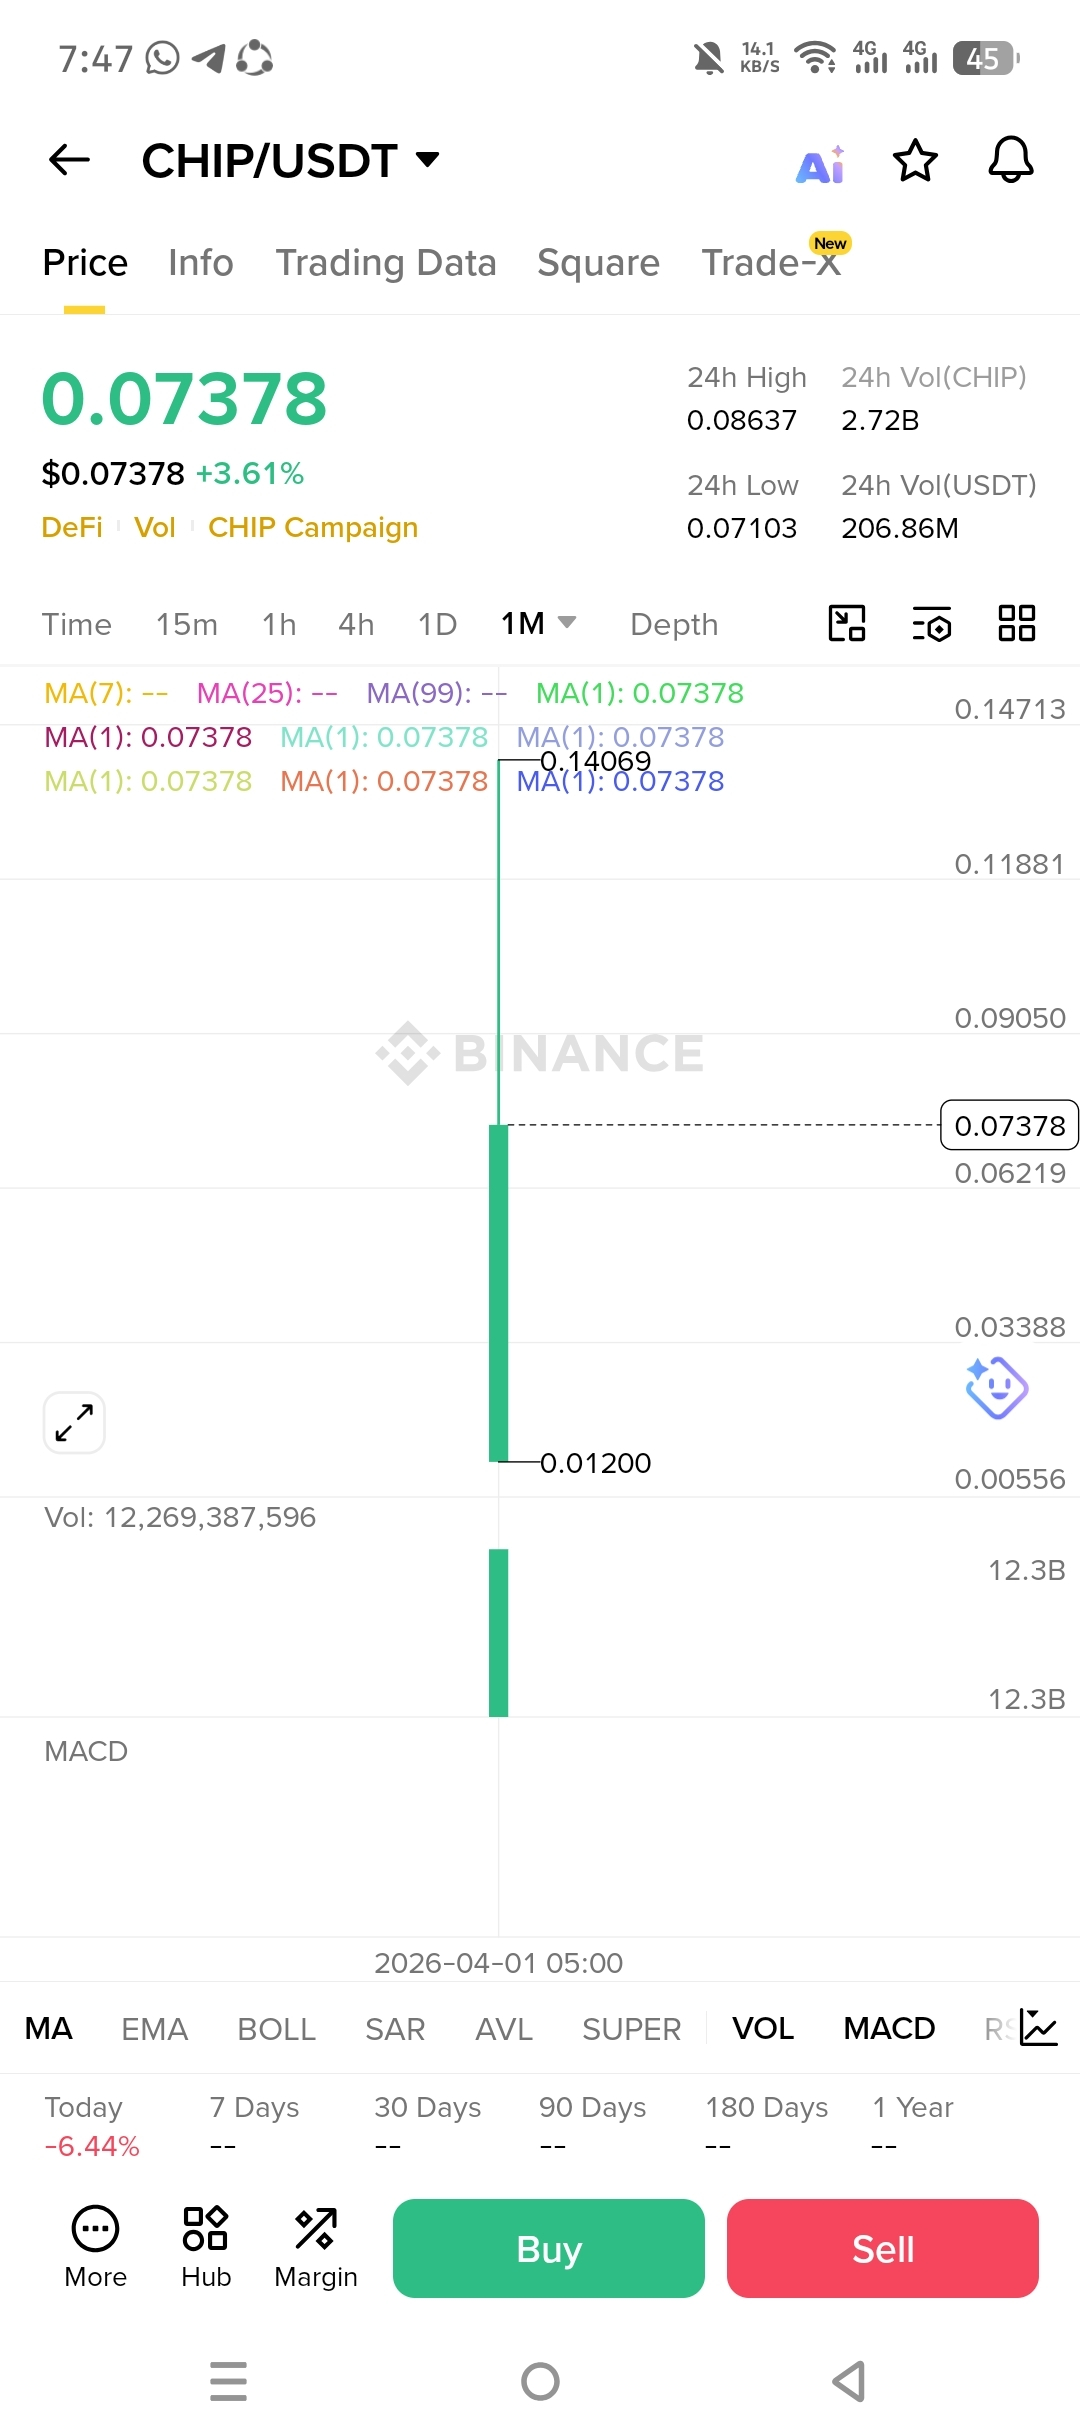
As of the current snapshot, CHIP is trading at $0.07378, reflecting a steady +3.61% gain.
24h High: $0.08637
24h Low: $0.07103
Trading Volume: A massive 2.72B CHIP (approx. 206.86M USDT) has been traded in the last 24 hours, indicating high liquidity and strong interest from both retail and whale investors.
Technical Breakdown 🔍
Looking at the 1-Month (1M) Chart, we see a massive "God Candle" that previously skyrocketed from $0.01200 to a peak of $0.14069.
Currently, the price is in a consolidation phase following that massive spike. The fact that it is holding above the $0.070 mark is a positive sign, suggesting that buyers are defending this level to build a base for the next leg up.
Future Outlook & Prediction 🔮
Bullish Scenario: If CHIP manages to break and close above the immediate resistance of $0.086, the momentum could quickly carry it back toward the $0.11 and $0.14 zones.
Bearish Scenario: If the price drops below the $0.071 support, we might see a further retest of lower levels before any recovery.
Final Thought 💡
The high volume suggests that CHIP is a "hot" coin right now. While the upside potential looks significant given its previous highs, always remember that volatility is high.
Strategy: Watch for a breakout above $0.086 for a confirmation of the bullish trend.
What’s your move? Are you HODLing CHIP or waiting for a better entry? Let me know in the comments! 👇
#BinanceSquare #CHIP #CryptoAnalysis #Altcoins #TradingSignals