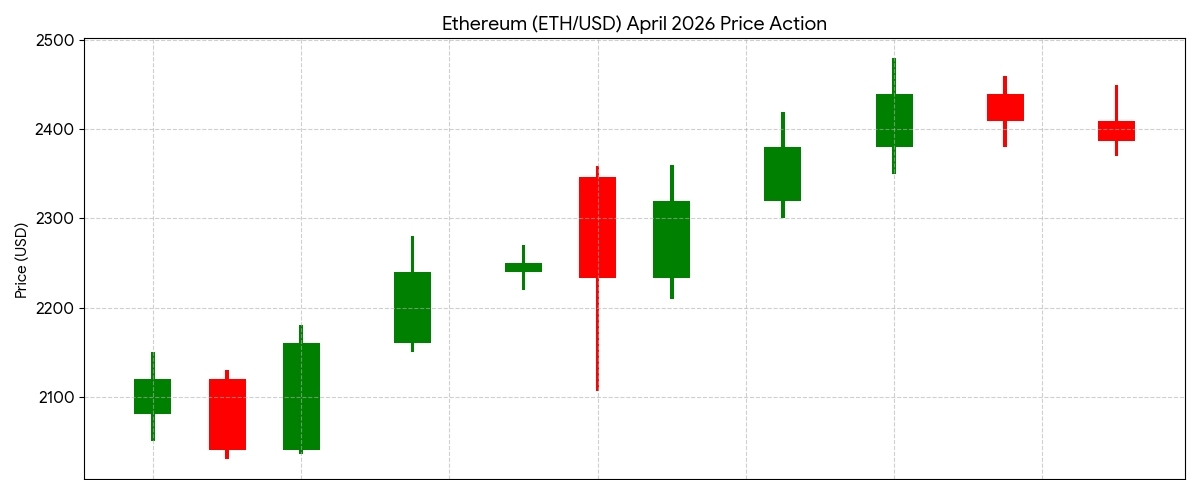
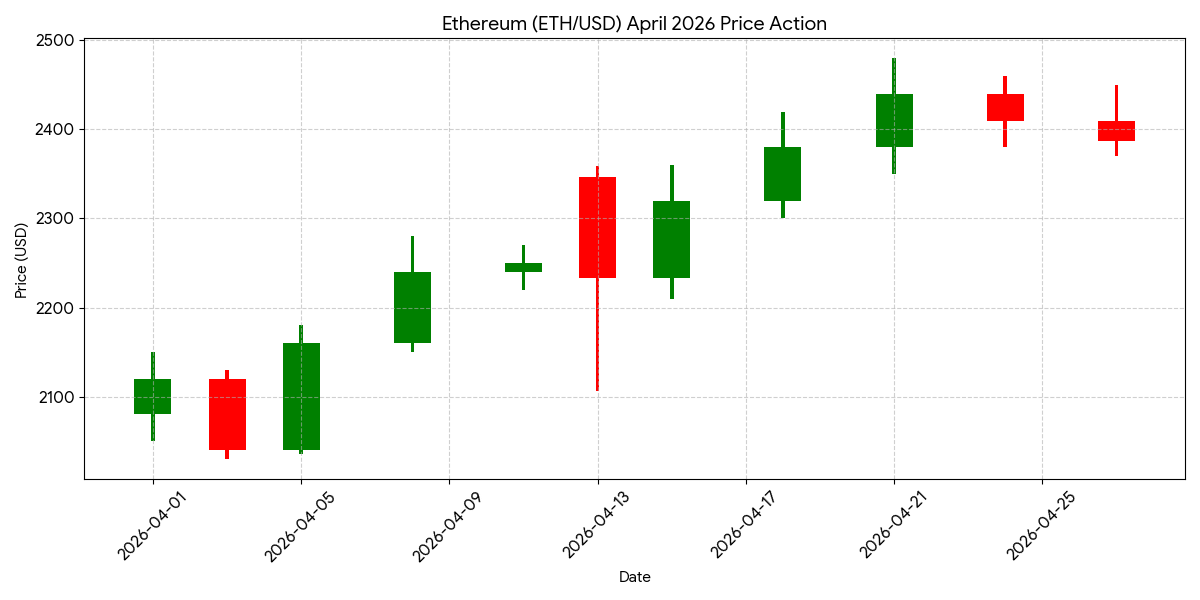
As of late April 2026, Ethereum (ETH) has experienced a notable month of volatility, moving from a consolidated base near $\$2,100$ to testing resistance in the $\$2,400$–$\$2,500$ range.
Short Technical Analysis (April 2026)
Market Sentiment:
ETH is currently up roughly 10% for the month. However, sentiment remains mixed. While institutional demand is reported to be strong, recent sales of over 20,000 ETH by the Ethereum Foundation have created localized selling pressure.
Key Support Levels:
$\$2,106$ – $\$2,176$:
This remains a critical floor. A sustained break below this could signal a drop toward the psychological $\$2,000$ level.

$\$2,313$ (Middle Bollinger Band):
Currently acting as dynamic support for the recent uptrend.Key Resistance Levels:$\$2,400$ – $\$2,500$: This is the immediate "supply zone." Analysts suggest a decisive close above $\$2,580$ (the 10-day EMA) is needed to invalidate the broader bearish structure from early 2026.
$\$2,661$:
The 10-day Moving Average serves as a significant trend ceiling.
Momentum Indicators:
The RSI is hovering around 44–53, placing ETH in neutral territory. This suggests the market is in a "wait-and-see" phase, with room to move in either direction without being overextended.