
Everyone is focused on the highs in the S&P 500…
and the strong rally in gold.
But the truth?
Looking at each one separately can be misleading.
The smarter metric is:
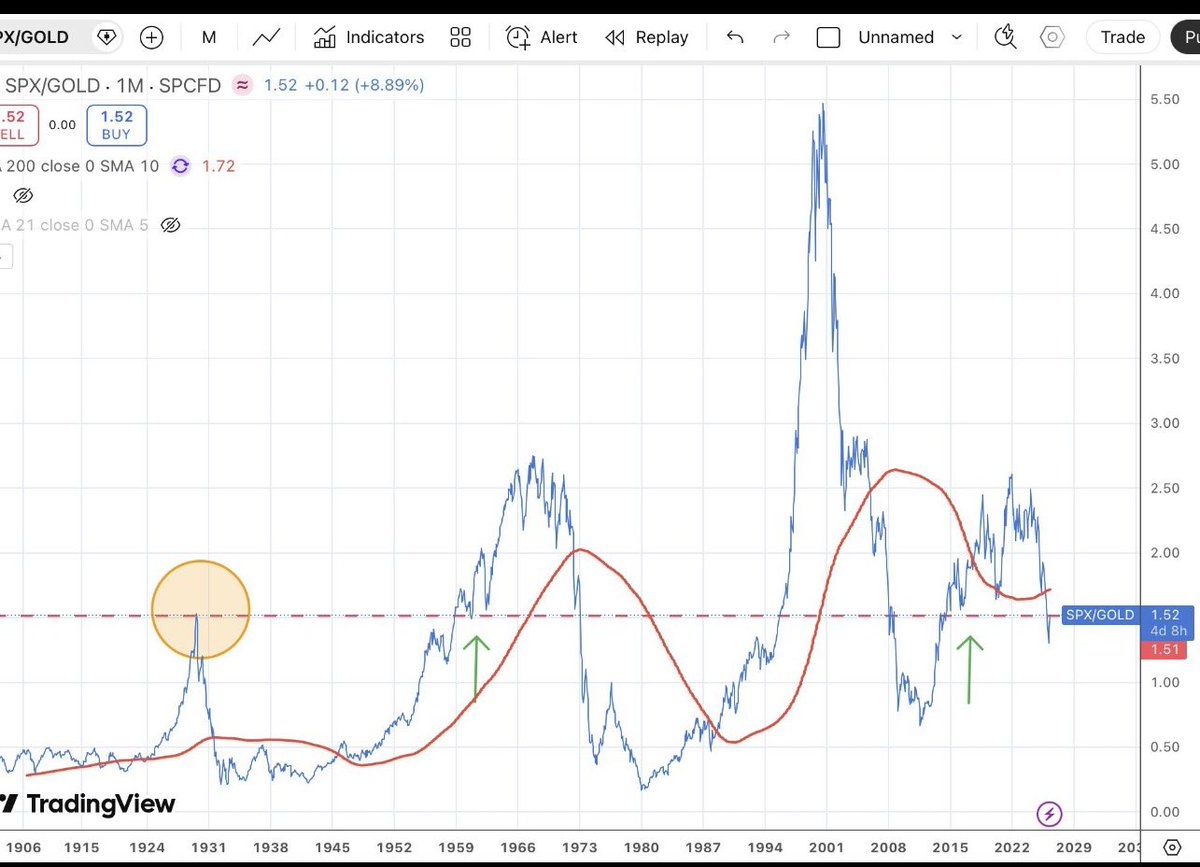
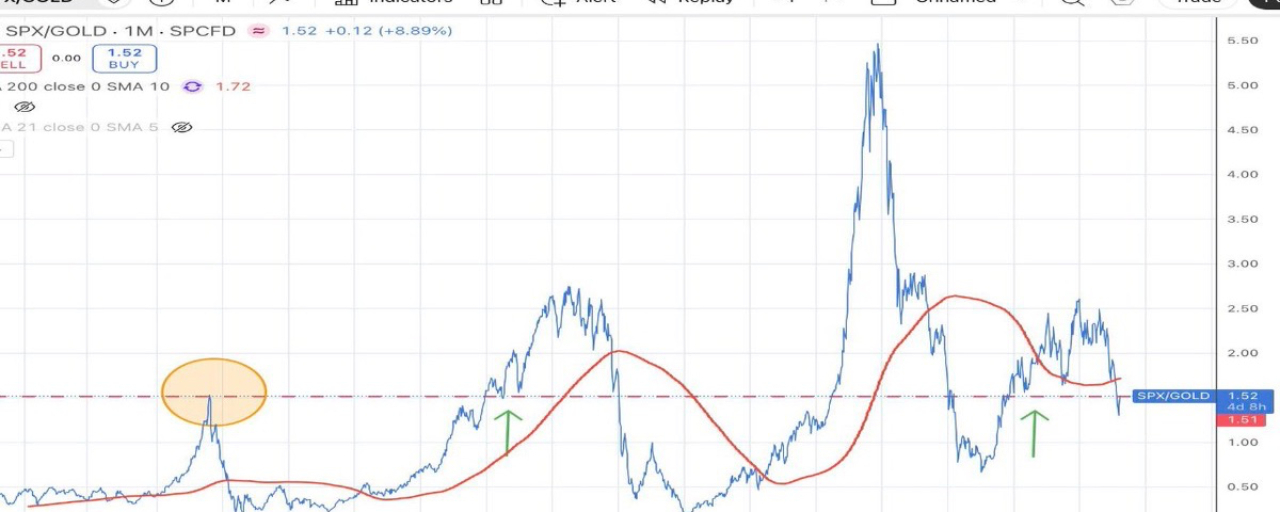
S&P 500 divided by gold (SPX/GOLD)
And this is where the story begins…
When you look at the long-term chart,
you’ll notice we’re now at the same levels seen at major historical turning points:
Before the Wall Street Crash of 1929
During the 1960s
In the mid-2010s
And each time?
There was a major shift in capital flows:
from equities… to real assets.
What’s happening now?
This level has been broken to the downside…
and is now being retested from below.
This isn’t just a technical detail.
It could be a signal of:
--> A global capital reallocation

If the ratio fails to reclaim this level…
Then we’re likely looking at a clear scenario:
Long-term outperformance of real assets over financial assets.
Here’s the twist:
This doesn’t necessarily mean stocks will fall.
It could mean:
Gold rises even faster
Both stocks and gold move higher
Or simply… equities lose purchasing power
 BTCUSDTPerp76,163.3-0.88%
Bottom line:
This isn’t a short-term move.
It could be a moment that reshapes
how the world invests in the next cycle.
So the real question is:
Are we at a new historical turning point…
or is this time different?