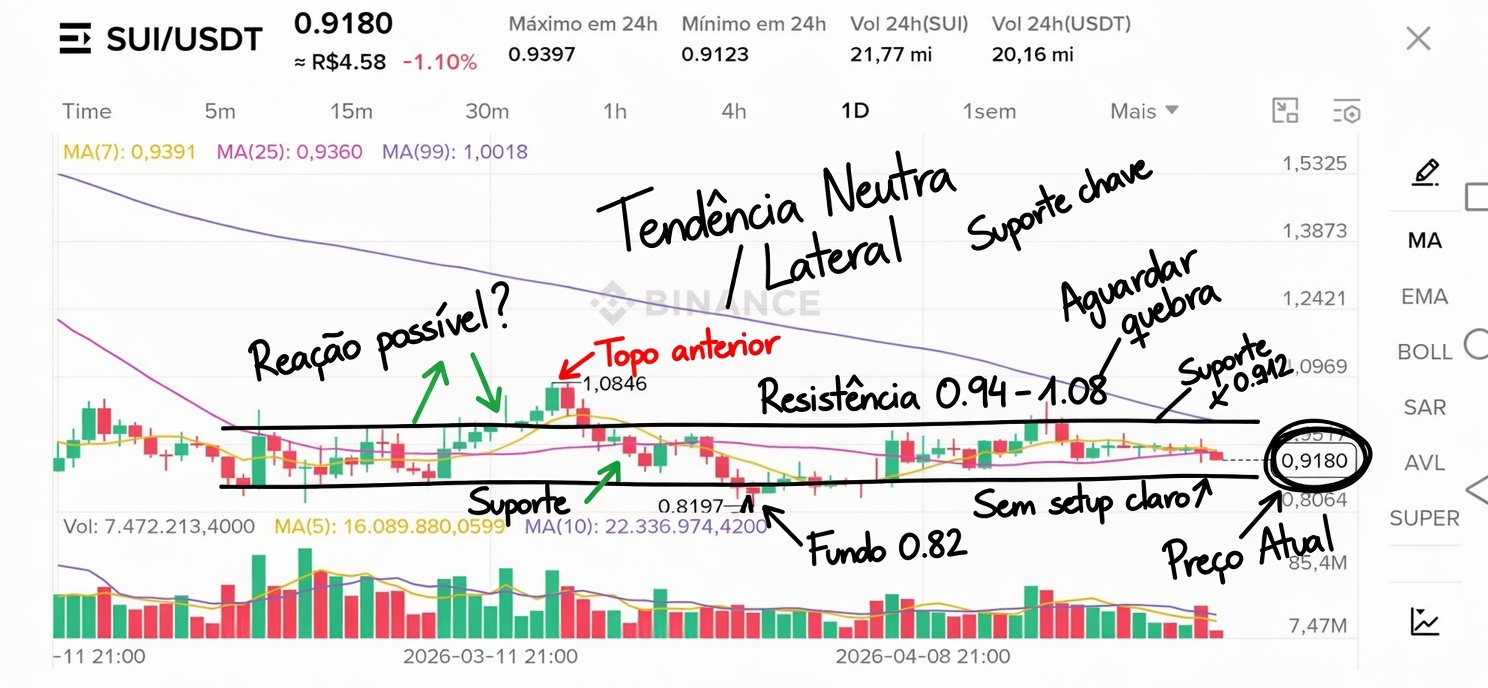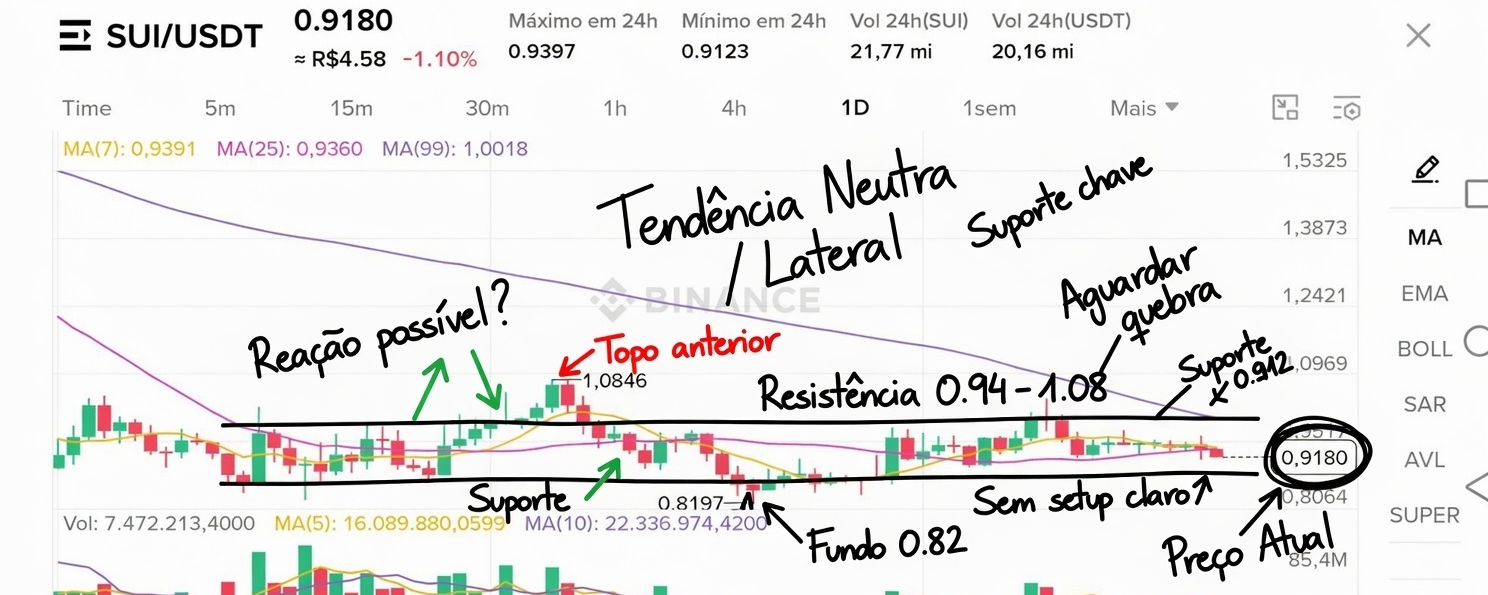
On the 1D candlestick chart for SUI/USDT, the price is at 0.9180 (-1.10% in 24h), very close to the low of 0.9123 and far from the high of 0.9397.
Market structure: after hitting the peak at 1.0846, the asset has entered a sideways consolidation. The moving averages MA(7) and MA(25) are very close to the current price (0.9391 and 0.9360), while the MA(99) remains above at 1.0018, indicating a lack of strong directional momentum. The volume is still not showing any decisive expansion.
Current trend: neutral (indecision/lateralization) within the range 0.912 – 0.94.
For the next 24 hours: neutral, with a slight recovery bias only if support at 0.9123 is held with strong candlesticks.
There’s no safe entry point at the moment — the price is compressed in a tight range with no clear breakout signal. Wait for a break above 0.94 with volume to consider a long position, or a loss of support for possible additional weakness.
Key support: 0.9123
Key resistance: 0.9397 / 1.0846
Consolidation continues to be the dominant scenario for SUI. Patience is essential.
What's your outlook for SUI in the short term?
#SUI #TechnicalAnalysis Crypto $SUI $BTC $ETH #BalancerAttackerResurfacesAfter5Months #CanTheDeFiIndustryRecoverQuicklyFromAaveExploit? #TetherFreezes$344MUSDTatUSLawEnforcementRequest #ShootingIncidentAtWhiteHouseCorrespondentsDinner #EthereumFoundationUnstakes$48.9MillionWorthofETH