After the Stock-to-Flow (S2F) model was dismissed, the current Power Law model shows that the Bitcoin price is approximately 20% lower than its fair value, while ETF capital inflow could push the price to both extremes of the model.
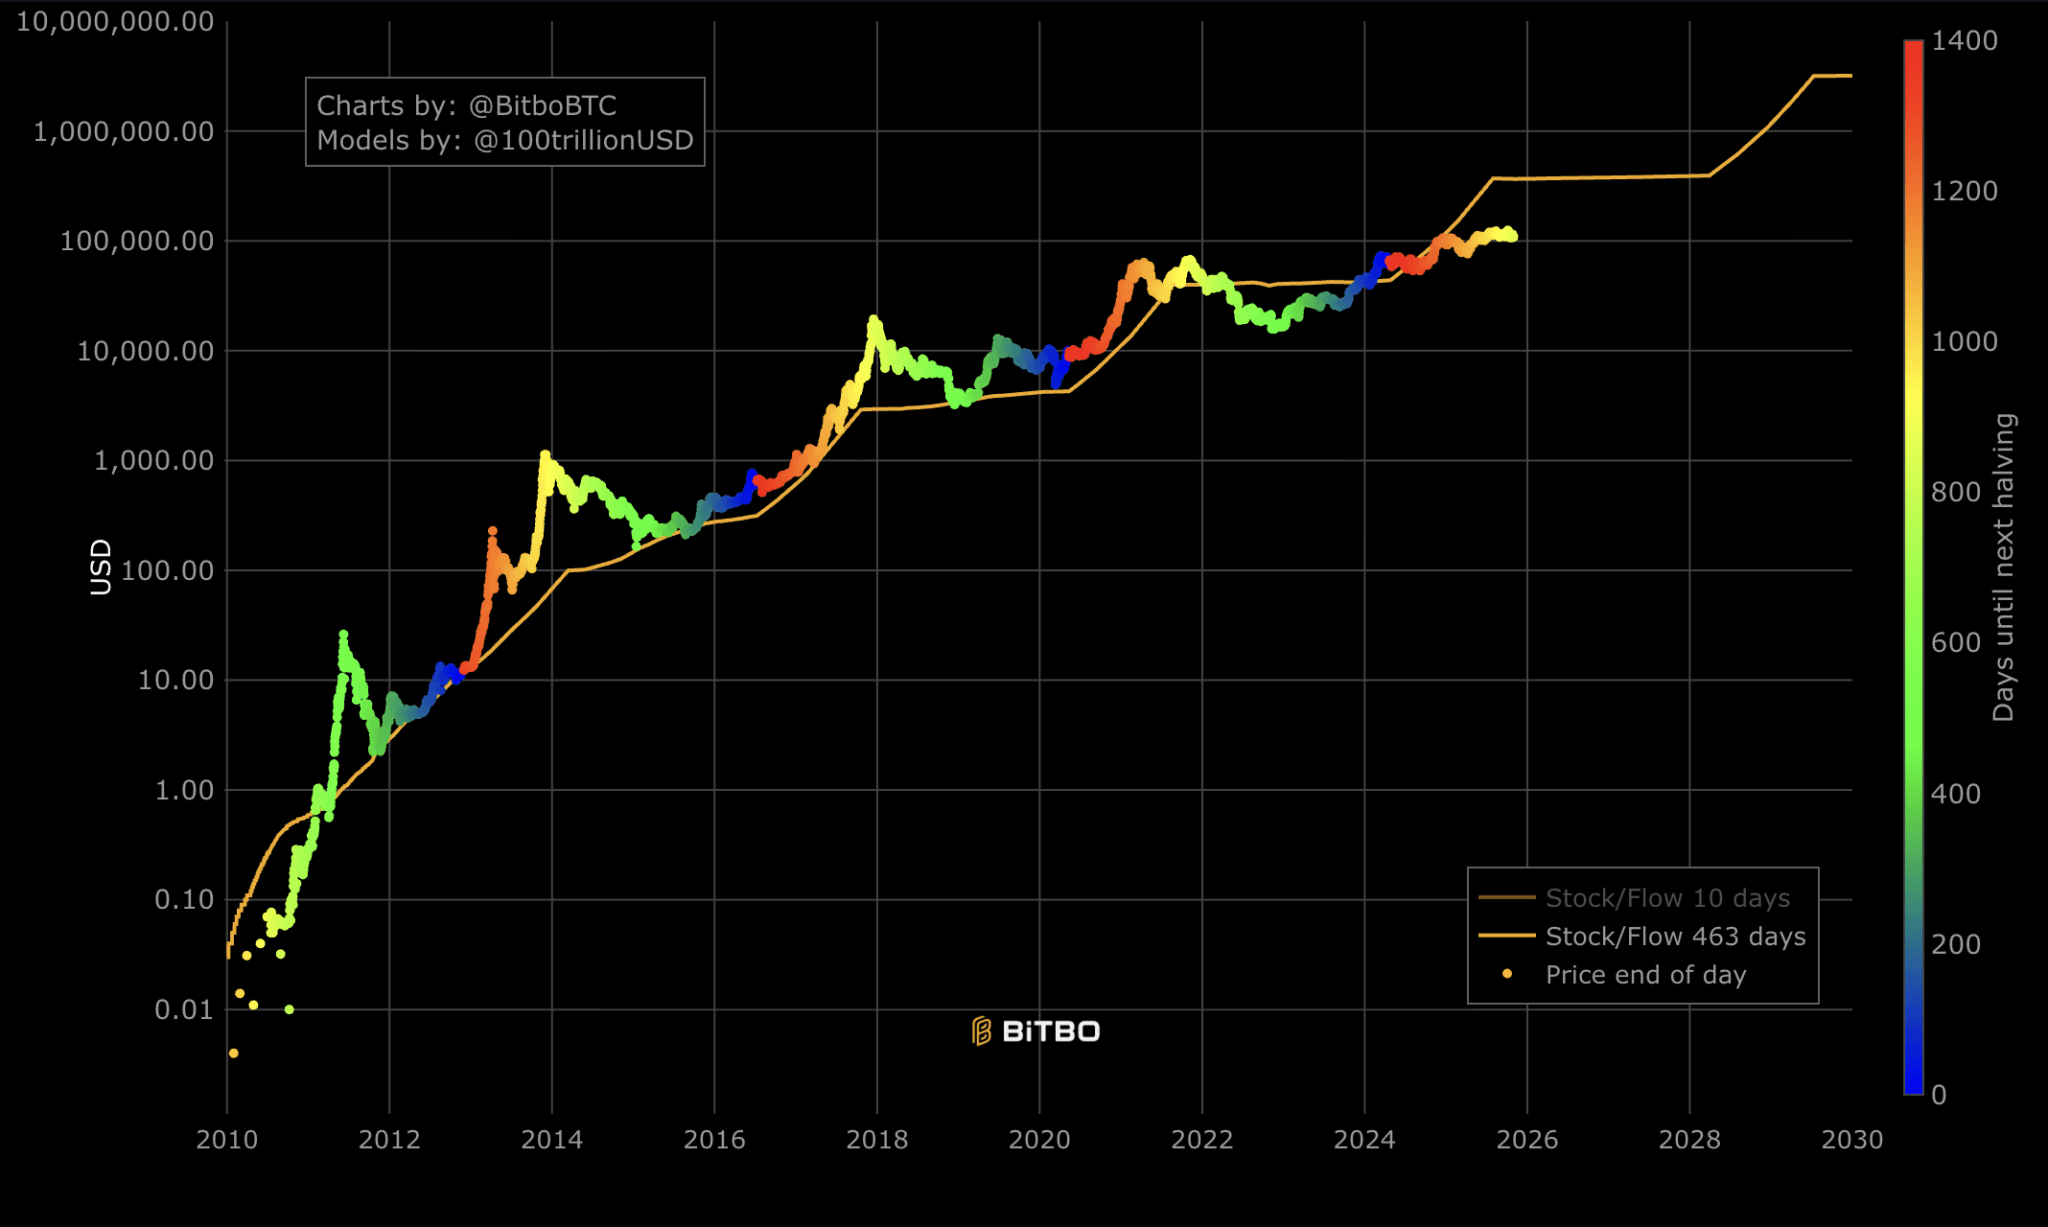
According to the Power Law model by Giovanni Santostasi implemented by Bitbo, the current BTC price is around 109,700 USD, with a fair value of approximately 136,100 USD, a support area at 48,300 USD, and resistance at 491,800 USD. This model positions the current Bitcoin cycle within an 'upward corridor' built on the Power Law correlation between price and time.
This channel is formed from a linear regression between log(price) and log(time since the network's inception), then this line is parallelly replicated to create two upper and lower bounds, which have encompassed historical cycle extremes. The result is a curve that increases over time, simulating the exponential growth rate of Bitcoin — more of a 'location map' than an accurate price forecast.


Currently, Bitcoin is trading approximately 20% lower than the fair value regression line and more than twice the floor level of the model — an intermediate position compared to the peaks and troughs of previous cycles before the price touches the upper or lower limits.
According to the parameters from BGeometrics, the fair value line is represented by the formula:
P ≈ 1.0117×10⁻¹⁷ × (days since Genesis)⁵·⁸², with the floor typically around 0.42 times the fair value line — corresponding to the current distance between the spot price and the lower bound of Bitbo.
This approach assumes that the rate of Bitcoin adoption increases exponentially over time, while volatility decreases as the network matures — reflected in the progressively narrowing amplitude of fluctuations around the regression line in subsequent cycles.

ETFs become the key variable of the new cycle
ETF capital flows currently explain why the price is in the middle of the channel rather than hitting extremes. In the week ending October 4, 2025, crypto exchange-traded products (ETPs) recorded a record 5.95 billion USD in net capital inflow, helping Bitcoin to reach a new peak of around 126,000 USD, mainly due to strong demand from US spot Bitcoin ETFs.
Two weeks later, CoinShares recorded 3.17 billion USD in capital inflow, then reversed to 513 million USD in outflows, with Bitcoin alone seeing 946 million USD withdrawn. Just in the last two days, 958 million USD has left US Bitcoin ETFs, including 290 million USD withdrawn from the BlackRock fund on October 30.
This rhythm aligns with the Power Law framework, where short-term spikes or drops push the price to the channel's boundaries, while the long-term trend remains linked to the value curve over time. The October peak coincided with a wave of new ETF registrations, indicating that ETFs are becoming a 'valve' for demand in the crypto market.
Three main scenarios
Base scenario: the price fluctuates around the regression line (~136,100 USD) with progressively decreasing amplitude if the volatility reduction characteristics continue.
Bullish scenario: strong ETF capital inflow and favorable macroeconomic conditions could push the price towards the upper bound (~491,800 USD).
Bearish scenario: monetary tightening, legal risks, or prolonged ETF capital withdrawals could cause the price to retest the lower bound (~48,300 USD).
These levels gradually increase over time as the exponential function of 'days since Genesis' is continuously multiplied. In other words, the bounds are not fixed targets but are 'guardrails' for the price.
Current Level MeasurementSpot Price≈ 109,700 USDFair Value (Regression)≈ 136,100 USDSupport (Lower Bound)≈ 48,300 USDResistance (Upper Bound)≈ 491,800 USD
The decline of Stock-to-Flow
Contrary to the Power Law, the Stock-to-Flow (S2F) model once promoted by PlanB has lost credibility after making incorrect predictions. S2F previously predicted 98,000 USD in November 2021 and 135,000 USD in December 2021, but the actual price was much lower. Vitalik Buterin criticized S2F as providing 'false precision,' while many researchers argue that this model overlooks demand and liquidity factors, as well as overemphasizing halving events.
Currently, S2F is seen more as a narrative about scarcity than as a tool for forecasting value.
Power Law – a model of time rather than specific dates
Proponents of the Power Law argue that this model can identify the amplitude and length of cycles without 'framing' time milestones. CoinPhoton once stated that Bitcoin might not trade below 100,000 USD after 2028, and could reach seven figures in the 2028–2037 period — but that is a price range, not a certain timeline.
A new factor to watch is ETF capital flow, a factor that could surpass the impact of halving.
ETF capital inflow above 2–3 billion USD/week will increase the likelihood of the price hitting the upper bound.
Continuous capital withdrawals will make it easier for the price to return to the regression area or the lower bound.
Macroeconomic liquidity — including interest rates, the strength of the USD, and the central bank's balance sheet — remains the main determining factor in whether the price stays on the regression line or not.
A 'simple yet sophisticated' model
The Power Law is constructed by taking the daily closing data of BTC/USD, converting it into log(price) and log(time since Genesis), then applying linear regression to determine the fair value line. From there, resistance and support lines are parallelly replicated, forming a gradually increasing corridor over time — a visual reference framework for the entire cycle.
This model does not directly account for ETF capital flow or liquidity cycles, but when monitored alongside macro data, it provides a useful positioning map: currently, the Bitcoin price is approximately 20% lower than its fair value, much higher than the lower bound, and the next position will depend on ETF capital flow and global monetary policy.

