
Bitcoin (BTC) bulls are working hard to protect the 110,000 USD mark, but pressure from bears has not diminished. This situation caused BTC to close the October candle in red — the first time in 7 years. According to data from CoinGlass, after a dismal October, investors are hoping for November, which historically has an average profit of 46.02%.
A section of analysts has started to lean towards a pessimistic scenario, believing that Bitcoin is approaching the peak of the four-year cycle according to halving periods. However, Arthur Hayes — co-founder of BitMEX — presents a contrary view, arguing that Bitcoin's traditional 'four-year cycle' has actually ended.
While it cannot be definitively stated whether this cycle has ended, the net capital outflow of 959.1 million USD from Bitcoin spot ETF funds in just the past two days (according to data from Farside Investors) shows that institutions are becoming more cautious in the short term.


So what are the crucial support zones that BTC and major altcoins need to hold? Let’s analyze the charts of the top 10 cryptocurrencies to find the answer.
Technical analysis of BTC
BTC bounced from the bottom around 107,000 USD on Thursday, indicating that bulls are strongly defending this support area.
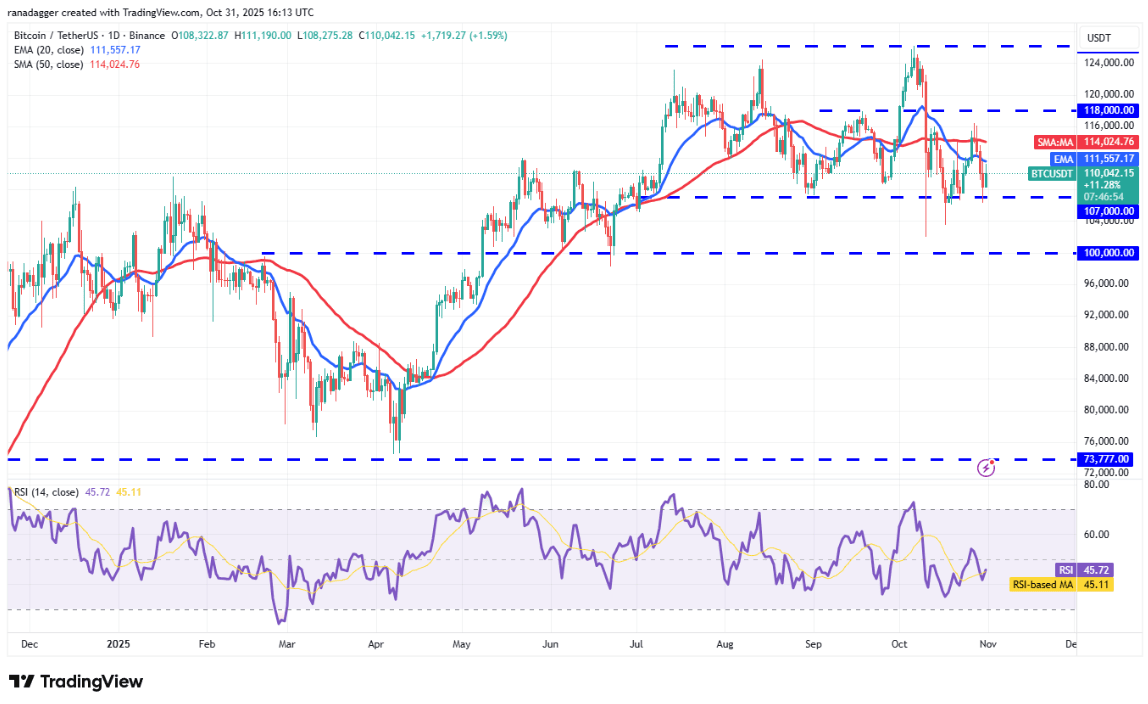
The recovery momentum may face resistance at the 20-day exponential moving average (EMA) at 111.557 USD. If the price is strongly rejected at this area, the risk of breaking the 107,000 USD threshold will increase. At that time, the BTC/USDT pair may complete a double top pattern and plunge to the 100,000 USD region.
Conversely, if BTC breaks out and closes a candle above the 20-day EMA, it indicates that the price may continue to oscillate within the range of 107,000–126,199 USD for some time.
Technical analysis of ETH
Ether (ETH) has bounced from the support line of the descending channel model on Thursday, indicating that buying power is emerging at lower price levels.
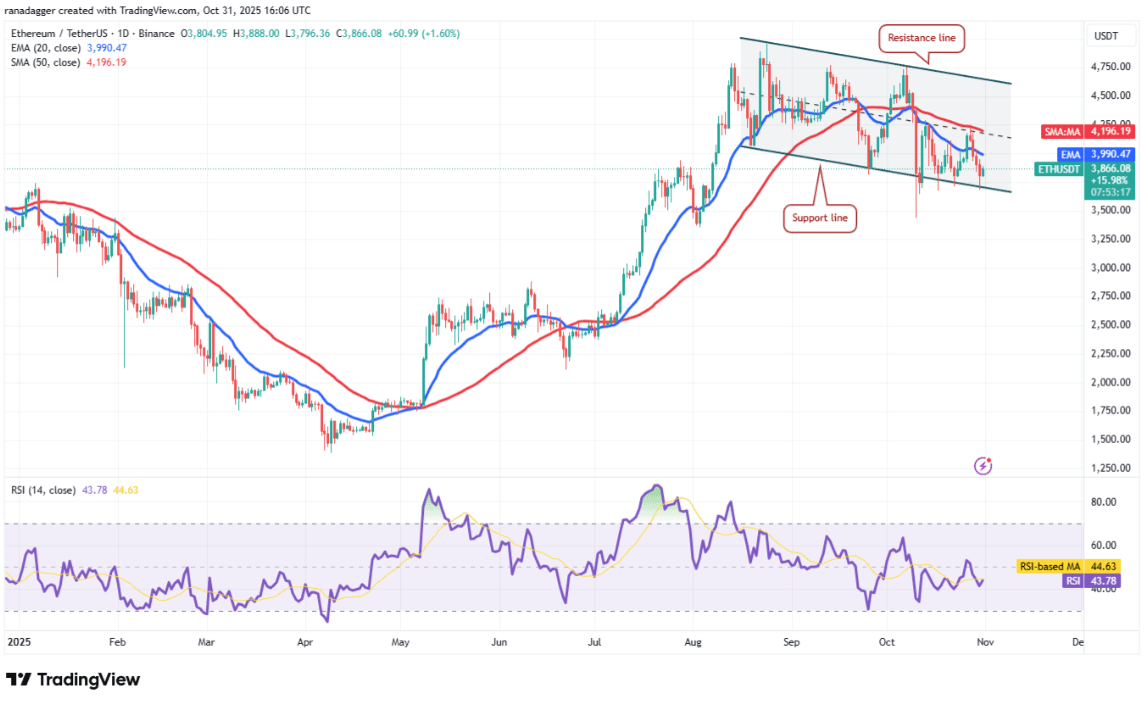
However, the recovery may encounter resistance at the moving averages. If the price is rejected here, bears will again attempt to pull ETH below the support line, and if successful, the ETH/USDT pair could plunge to the 3,350 USD region.
Bulls need to push the price above the moving averages to maintain a sideways trend within the channel. A new upward move will only be truly confirmed when the price breaks out and closes above the resistance of the model.
Technical analysis of BNB
BNB is witnessing a fierce tug-of-war between bulls and bears around the 50-day simple moving average (SMA) at 1.084 USD.
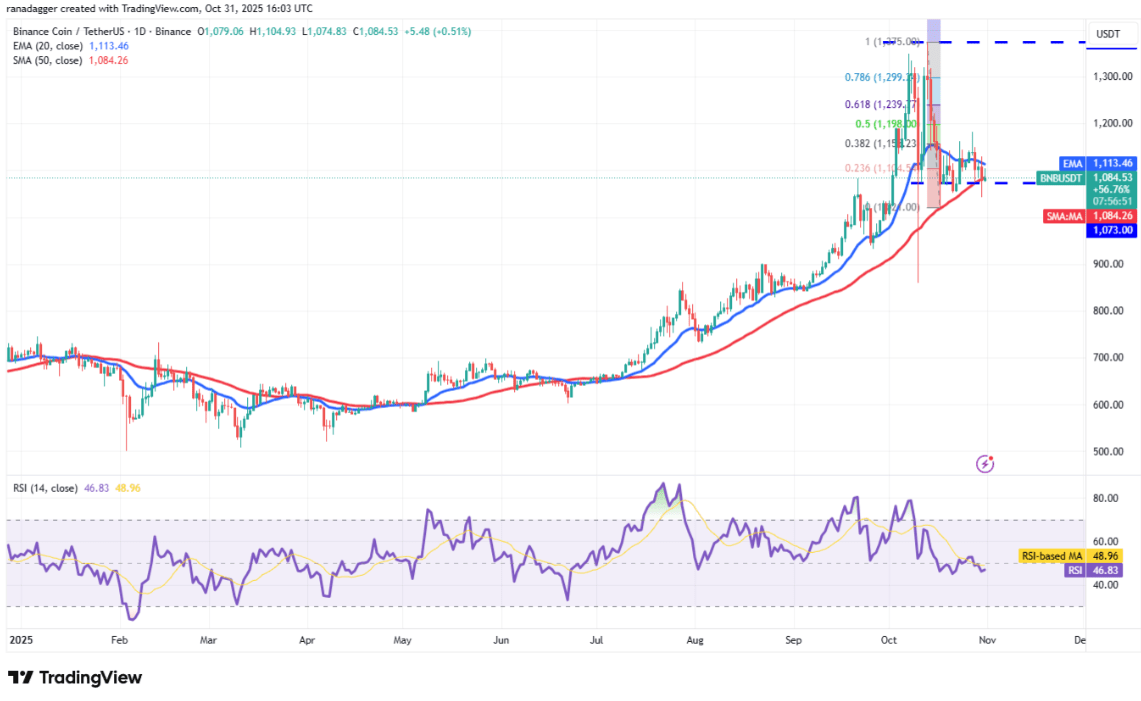
If the price turns down from the 20-day EMA (1,113 USD) and closes below the 50-day SMA, this will trigger a deeper correction. The BNB/USDT pair may retreat to the 1,021 USD region, and further down to 932 USD.
Conversely, if the price closes above the 20-day EMA, bulls may temporarily regain control. At that point, BNB may aim for the 38.2% Fibonacci level at 1,156 USD, where selling pressure may appear. If it successfully breaks through this area, the uptrend may extend to the 1,239 USD mark (the 61.8% Fibonacci level).
Technical analysis of XRP
XRP dropped below the 20-day EMA (2.54 USD) on Thursday, indicating that bears are in control.
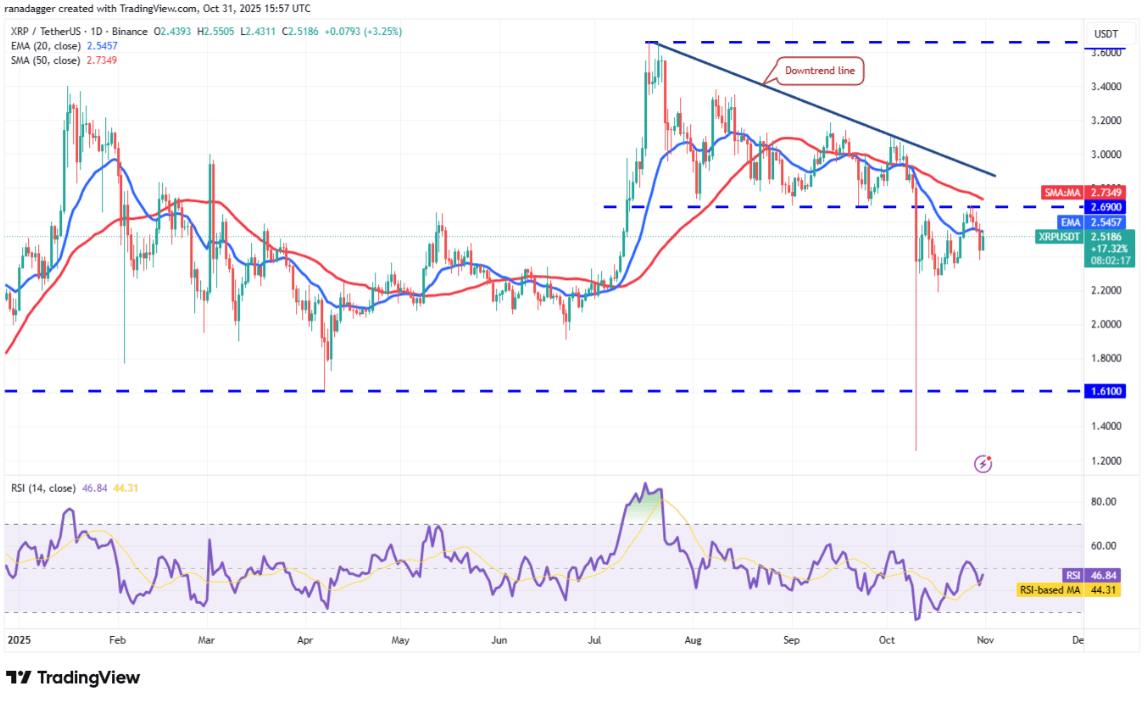
If the downtrend continues, the price may retreat to the support zone of 2.32–2.19 USD. Bulls are expected to defend this area strongly, as if it breaks, selling pressure may increase significantly, pushing the XRP/USDT pair down to 1.90 USD.
Time is running out for the bulls. They need to quickly push the price back above the moving averages to regain control. A trend reversal signal will only appear when the price closes above the downtrend line.
Technical analysis of SOL
Solana (SOL) is currently oscillating within a symmetrical triangle pattern, indicating the market's hesitation about the next direction.
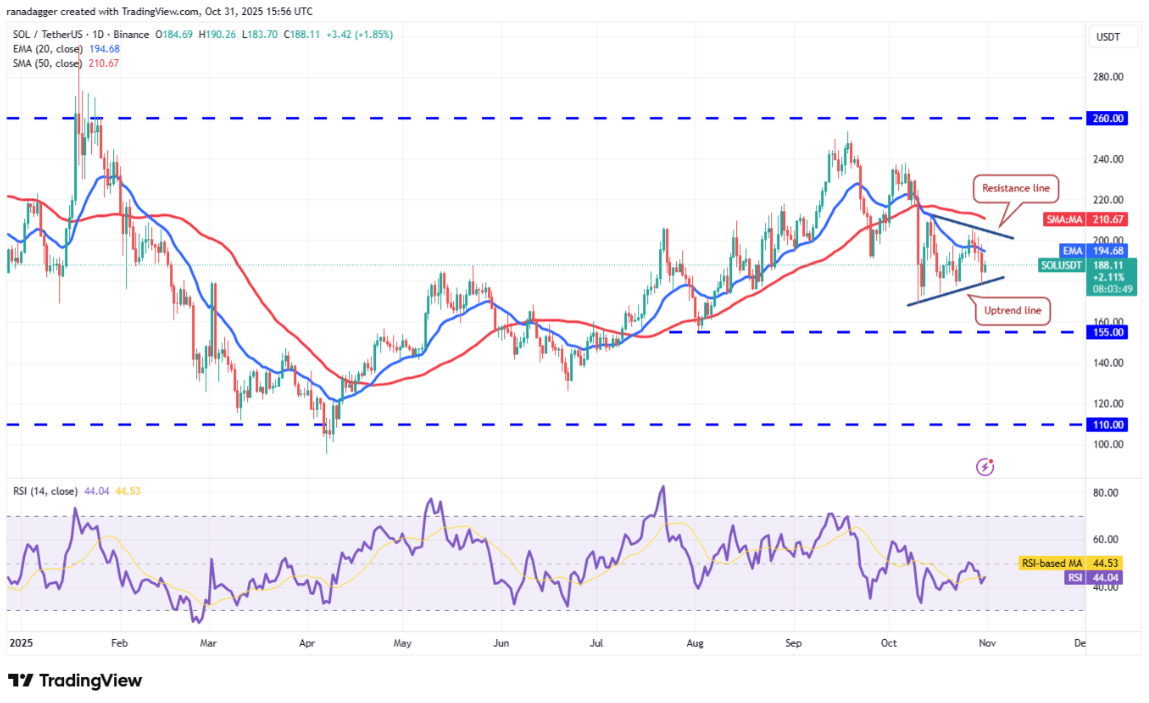
If the price dips below the uptrend line, the SOL/USDT pair could sharply decline to the solid support area at 155 USD. Bulls are likely to defend fiercely here, as if this area is broken, the price could plummet to the 140 USD mark.
Conversely, if SOL bounces from the uptrend line and breaks above the 20-day EMA (194 USD), this coin may continue to oscillate within the triangle for some time. Bulls will regain an advantage if they push the price above the resistance line of the model.
Technical analysis of DOGE
Bulls are trying to keep Dogecoin (DOGE) above the support level of 0.17 USD, but the weak recovery indicates that bears are still maintaining strong pressure.
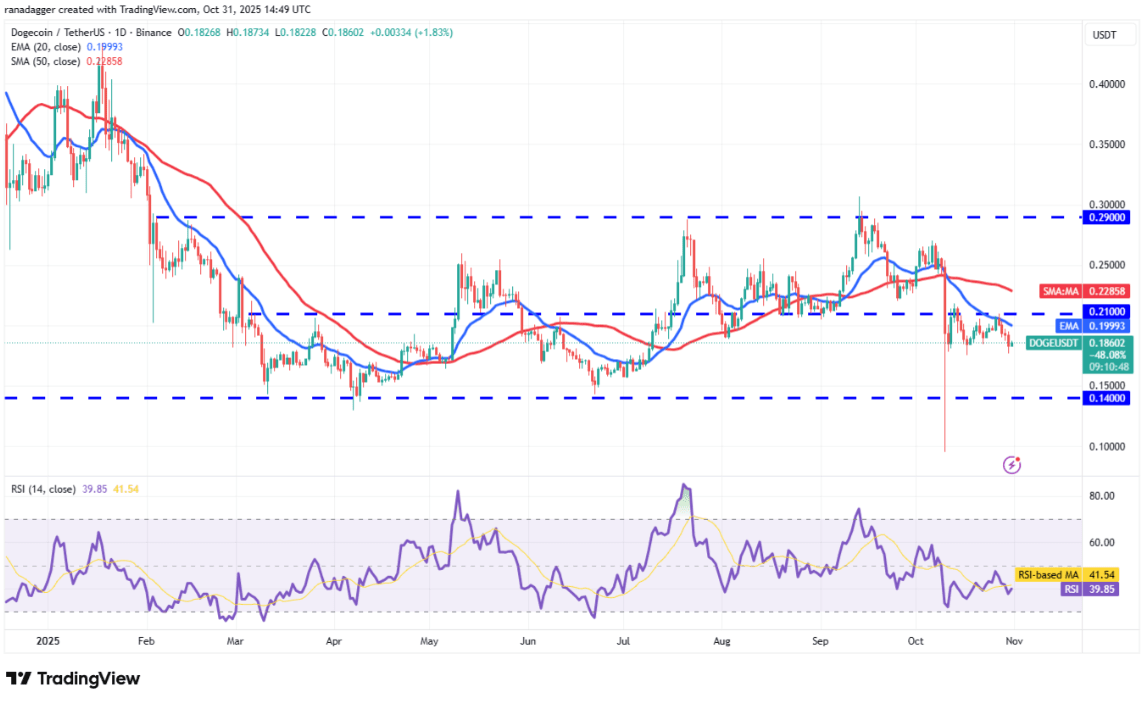
If the 0.17 USD threshold is breached, the DOGE/USDT pair may drop to the next support zone at 0.14 USD. Bulls may try to keep the price within this range, but if they fail, DOGE could fall to the 0.10 USD area.
The first positive sign will appear when the price breaks out and closes above the resistance of 0.21 USD. At that point, the currency pair could advance to the SMA 50 (0.22 USD) and even challenge the strong resistance zone at 0.29 USD.
Technical analysis of ADA
The price of Cardano (ADA) continues to decline and has broken through the support level of 0.59 USD on Thursday, indicating that bears still have control over the market.
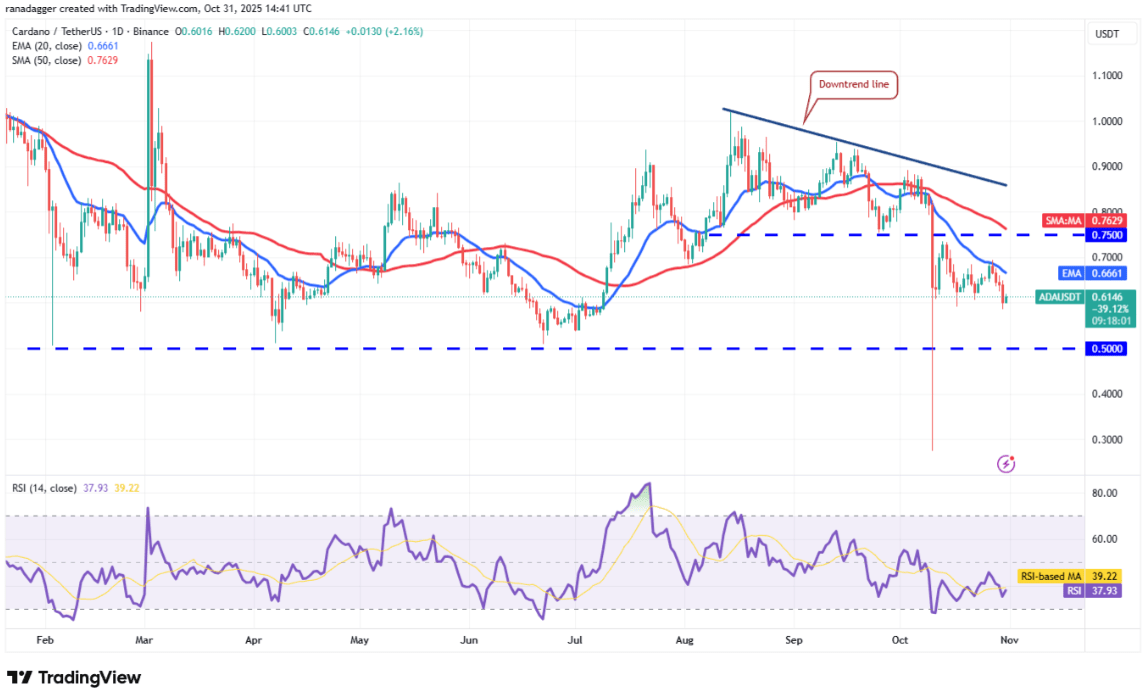
If the price remains below the 0.59 USD mark, the ADA/USDT pair may drop deep into the strong support area at 0.50 USD. It is likely that bulls will defend this level fiercely, as breaking below 0.50 USD may trigger a new downtrend.
On the contrary, if the price breaks and closes above the 20-day exponential moving average (EMA) at 0.66 USD, this will indicate that bears are gradually losing their advantage. At that point, the price of Cardano could bounce up to the 0.75 USD area – the nearest breakout level, and further to the downtrend line.
Technical analysis of HYPE
Bears once again thwarted the bulls' efforts to push the price of Hyperliquid (HYPE) above the resistance level of 51.50 USD on Thursday, pulling the price back down towards the 20-day EMA around 43.10 USD.
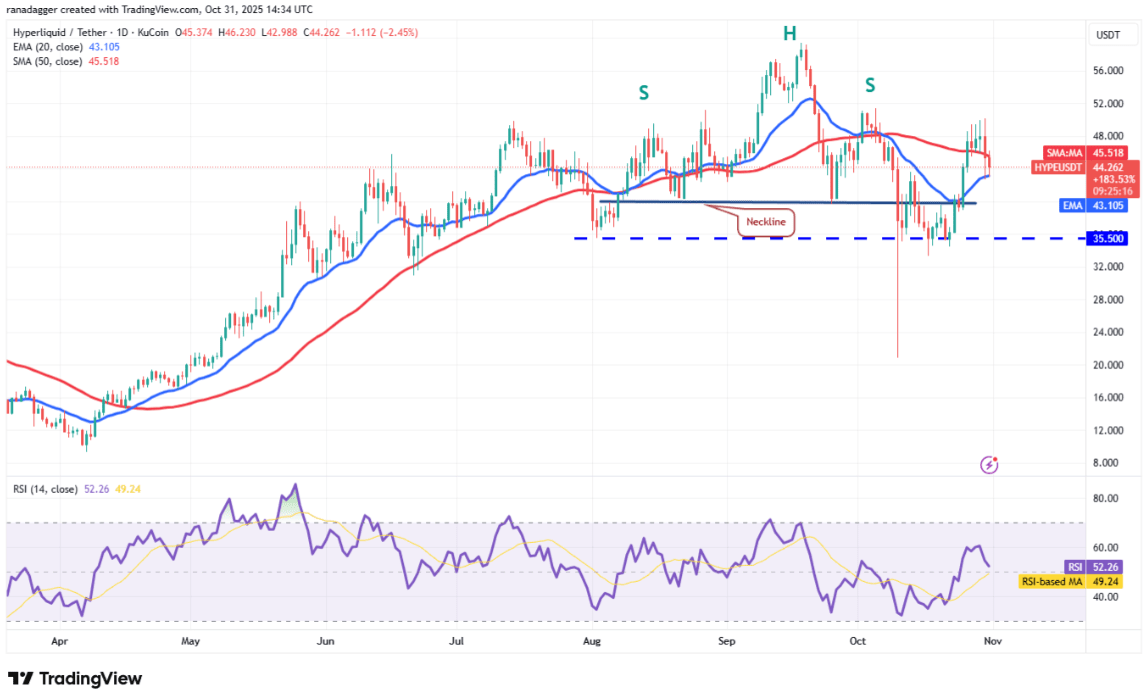
Currently, bulls are trying to defend the 20-day EMA, but selling pressure remains strong. If the price breaks below this line, the HYPE/USDT pair could drop to the neckline and continue to decline to 35.50 USD.
This negative outlook will be invalidated in the short term if the price of Hyperliquid reverses upward and exceeds the threshold of 51.50 USD. At that point, the currency pair may break out to a historical high of 59.41 USD.
Technical analysis of LINK
Bulls attempted to push the price of Chainlink (LINK) above the 20-day EMA at 18.24 USD on Wednesday, but bears still held their ground.
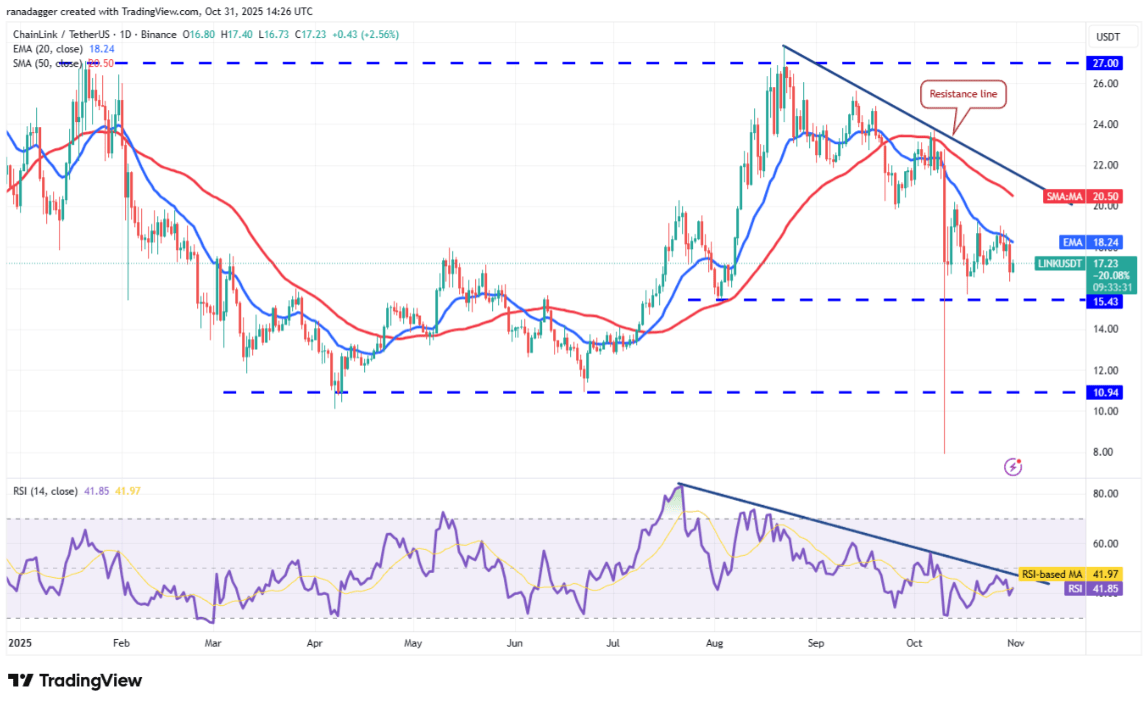
The moving averages are sloping down along with the relative strength index (RSI) in the negative zone, indicating that bears are still in control. The price of Chainlink may continue to plunge to the support zone of 15.43 USD, where bulls are expected to enter strongly.
To regain upward momentum, bulls need to push the price above and maintain it on the 20-day EMA. At that point, the LINK/USDT pair could move towards the resistance line – a key level to watch in the short term.
Technical analysis of BCH
The price of Bitcoin Cash (BCH) is oscillating within a narrow range between the 20-day EMA (530 USD) and the resistance line in recent days.
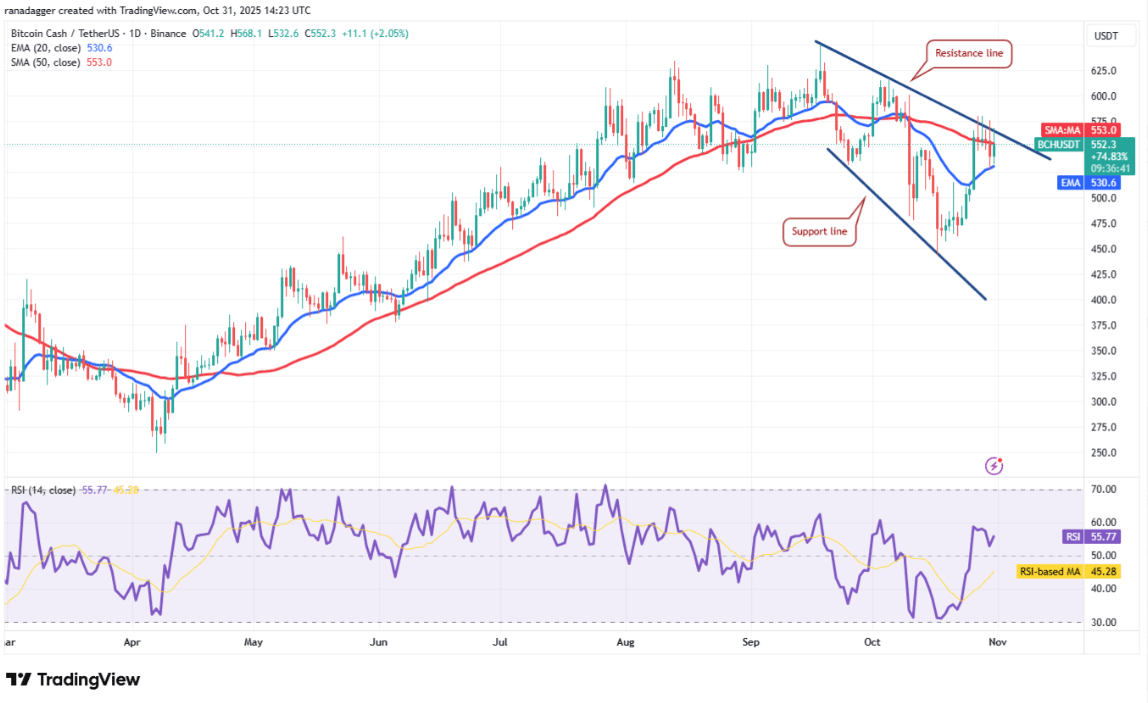
Bulls need to push the price above and maintain it on the resistance line to signal a trend reversal. At that point, the BCH/USDT pair could bounce up to 615 USD and then to 651 USD.
Conversely, if the price turns down and breaks below the 20-day EMA, it indicates that the currency pair may continue to oscillate within a falling wedge pattern for some time. At that point, the price may retreat to 500 USD and even to 475 USD.


