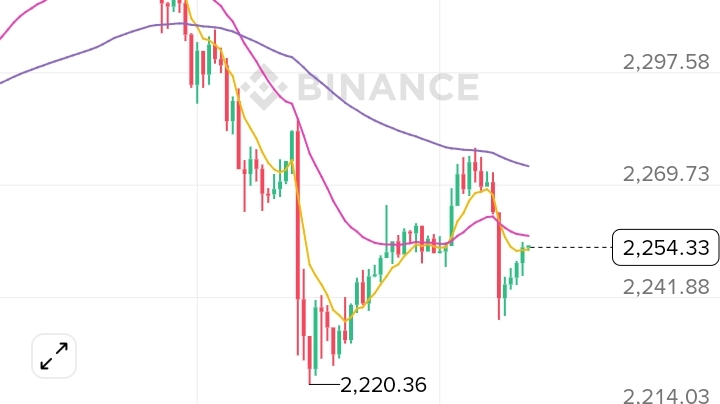
Looking at the current ETH/USDT 15-minute chart, the market is showing a clear short-term downtrend followed by a weak recovery. Price recently dropped from around $2,346 to a low near $2,220, indicating strong selling pressure. Although there’s a bounce back toward $2,250, the structure still looks cautious.
The EMA indicators tell an important story:
Price is hovering around the short-term EMA(7) and EMA(25), showing indecision.
The long-term EMA(99) is still above the current price, suggesting the broader trend remains bearish in the short term.
Volume spikes during the drop confirm that sellers dominated the move. The recent smaller candles and lower volume suggest the current recovery lacks strong momentum—more like a pause than a reversal.
What does this mean?
Ethereum is in a consolidation phase after a sharp dip. If buyers gain strength and push above the $2,270–$2,300 zone, momentum could shift bullish again. But if support near $2,220 breaks, further downside is possible.
$ETH #Ethereum #crypto #ETHUSDT #TradingCommunity #blockchain