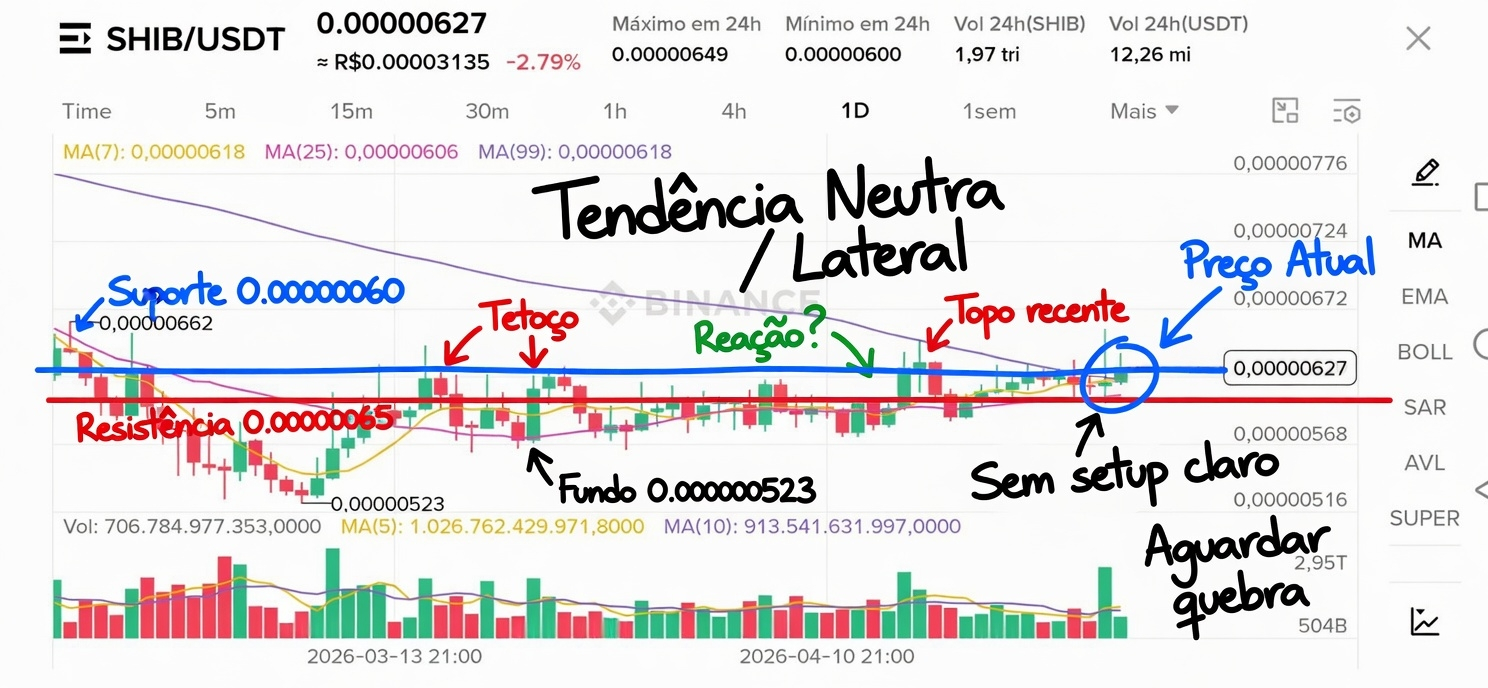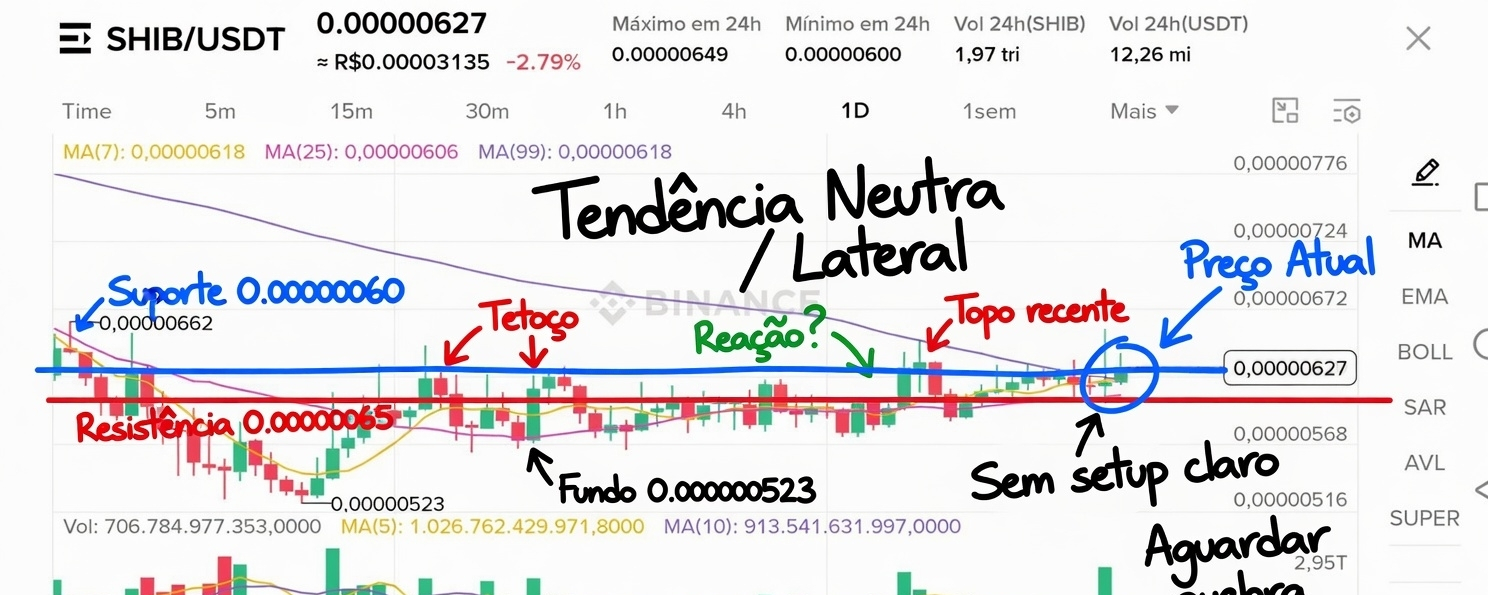
On the 1D chart for SHIB/USDT, the price is at 0.000000627 (-2.79% in 24h), testing the area close to the low of 0.000000600 after getting rejected at the top of 0.000000662.
Market structure: since the bottom at 0.000000523, the asset has been oscillating in a very tight range. The moving averages are practically glued together (MA(7), MA(25), and MA(99) all around 0.000000618), indicating low volatility and a lack of clear directional trend. The volume shows isolated spikes without consistent strength in accumulation or distribution.
Current trend: neutral (indecision/sideways) in a tight range.
For the next 24h: neutral, with a slight recovery bias only if support at 0.000000600 is defended with green candlesticks.
There’s no safe entry point at the moment — the range is too tight to offer good risk/reward, and the risk of whipsaw is high. Wait for a clear breakout above 0.000000649 with volume to consider a long position, or a loss of support for a possible bearish continuation.
Key support: 0.000000600
Key resistance: 0.000000649 / 0.000000662
In memecoins like SHIB, patience and volume confirmation are essential before any trade.
What's your read on SHIB in this range?
#SHIB #ShibaInu #TechnicalAnalysis $SHIB $BTC