
Hey, Good Morning, Crypto Fam!
Today I'm bringing you the third part of Perpetual Futures Trading, focused on the Technical Analysis section (just images).
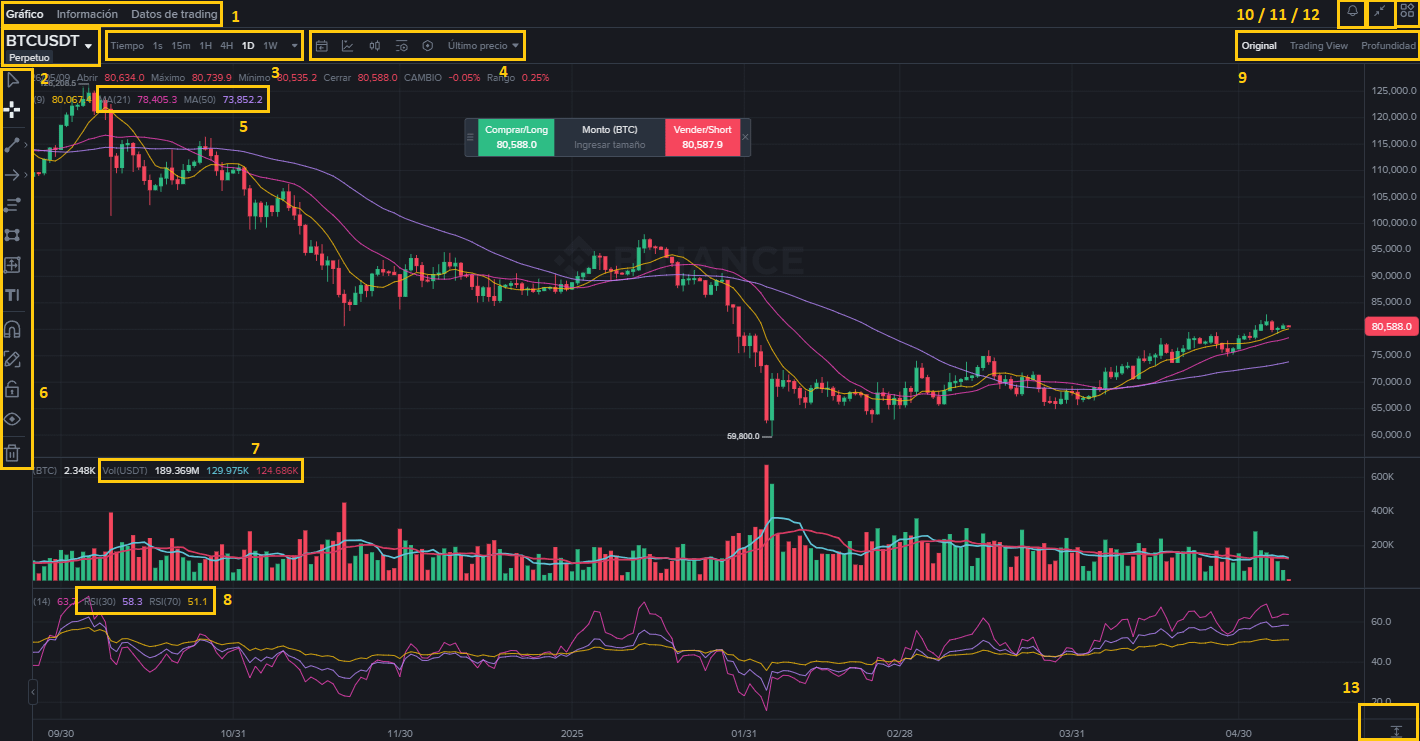
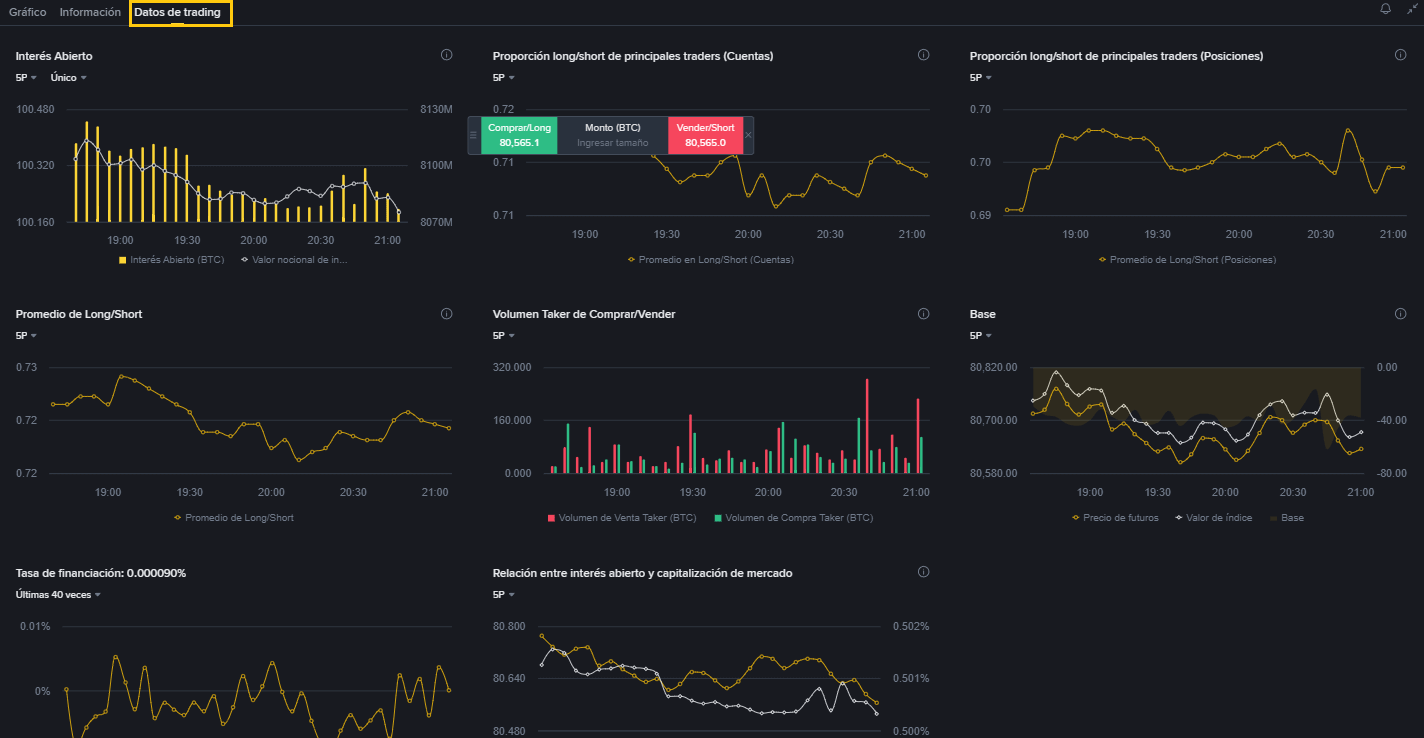
01.- Chart Sections, Trading Info, and Data; in these sections, you'll find the most info and data on the technical analysis of the selected coin, its attributes, features, and projections.
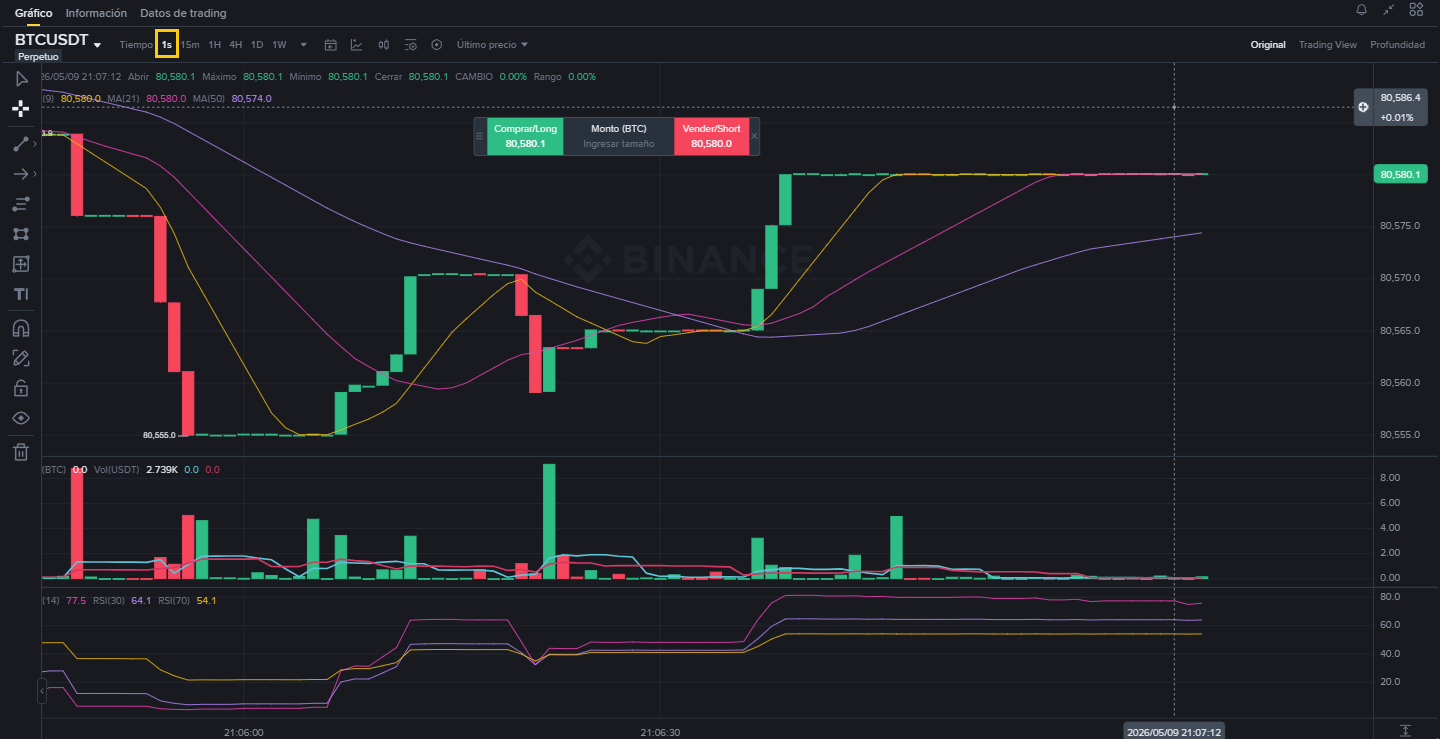
02.- Selected Coin $BTC

03.- Timeframes Section. Here, we break down the time according to the study before and during a trade or contract. Each candlestick represents a day, as shown in the image.
04.- Section of icons with specific functions like the Technical Indicator (second from left to right) where you set the ranges for EMAs, Volumes, and RSI; last price, among others.
05.- EMA Indicators.
06.- Command Bar to modify the panel and make graphical predictions on the movement of the candlesticks based on technical analysis.
07.- Volume Indicators.
08.- RSI Indicators.
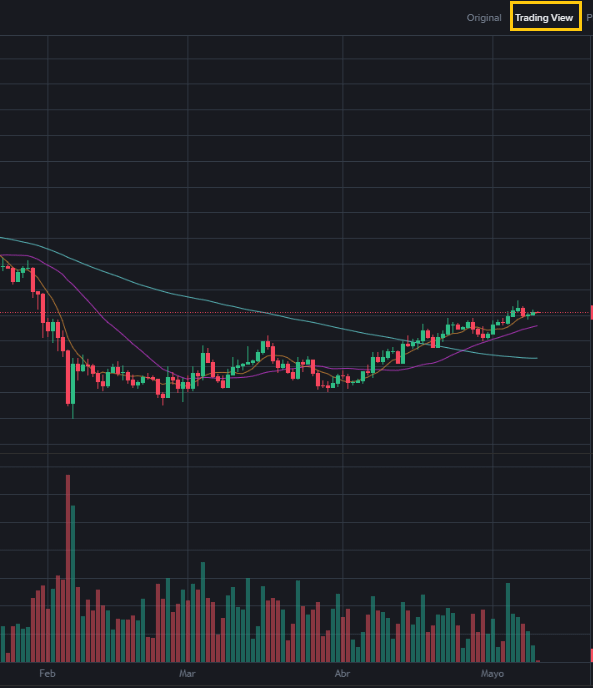
09.- Type of chart in the Panel.
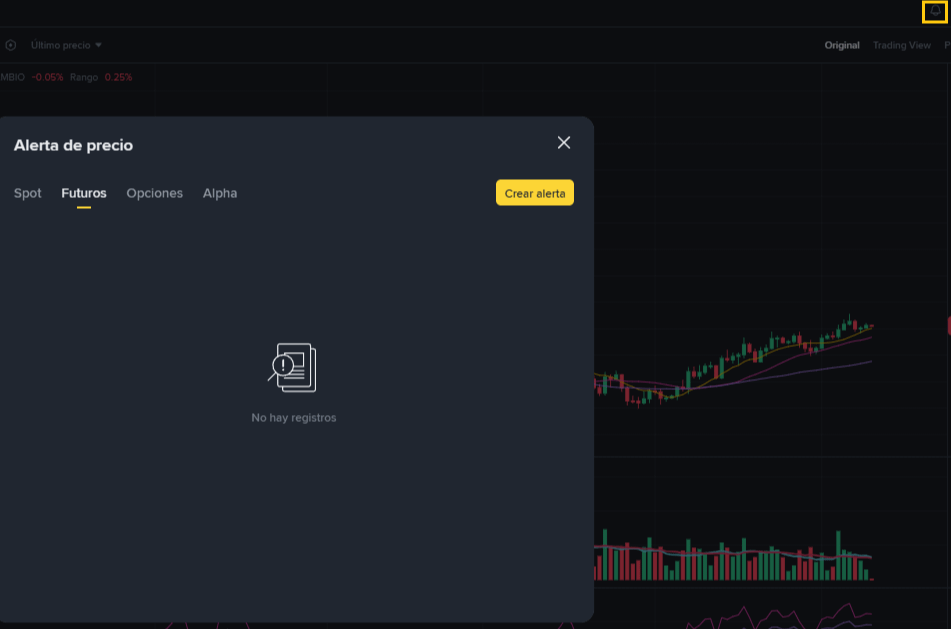
10.- Price Alert (Bell) from left to right.
11.- Maximize and Minimize the screen for better visualization.
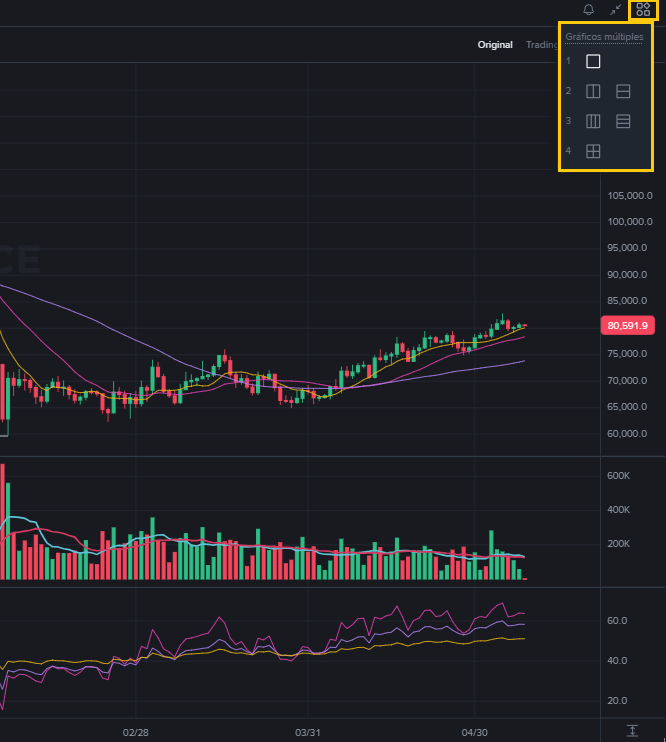
12.- Control of multiple chart tools on the screen.
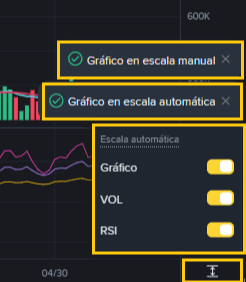
13.- Automatic or Manual Screen Control, as well as manual control of charts, volumes, and RSI.
All is That’s Friends - It’s all good, friends.
The purpose of this article is to provide you with a technical overview of the landscape that Master Traders and Pros navigate before executing a Buy and Sell contract in Perpetual Futures.
Legal Notice: This is not Financial Advice, it is an Educational article. Trade at your own risk.